18 Laminar Cylinder Vortex Shedding — PBNS Strouhal/CD/CL Validation
Validation of the compressible pressure-based coupled solver against literature values at Re=100
18.1 Run Provenance and Artifacts
| Item | Value |
|---|---|
| Wake CFD baseline version | 0.23.0 |
| Solver | PBNS |
| Compute device | GPU (NVIDIA RTX A2000) |
| Parallel execution | 1 MPI rank |
| Arithmetic precision | Mixed |
| Run date | 2026-10-20 |
Results depend on the solver build that produced them. Read every figure in this report together with the version and date above — re-running the same input on a later build may give different numbers.
A first attempt with an older build (2026-08-21) did not reach a usable result and is not reported here; the results below come from the single run of 2026-10-20.
18.1.1 Downloadable Files
Not available: standalone input decks and solver result files have not yet been published for download.
18.2 Validation Objective
This case checks whether the compressible pressure-based coupled solver (PBNS) reproduces the laminar von Kármán vortex street behind a circular cylinder at Re_D=100. The comparison is with literature values for three quantities: the Strouhal number St, the mean drag coefficient CD, and the lift-coefficient amplitude CL_amp. It also checks the frequency relation between drag and lift (drag oscillates at twice the lift frequency) and the split of drag into pressure and friction parts. The case is a validation of one solver at one condition, not a comparison with the density-based solver.
18.3 Reference Solution and Data
The Kármán vortex street at Re_D=100 is a standard unsteady validation case with established values for St, mean drag, and lift amplitude. At this Reynolds number the wake is laminar and two-dimensional — three-dimensional instability sets in near Re_D≈190 — so a two-dimensional simulation is physically appropriate.
18.3.1 Experimental Data
| Quantity | Literature value | Source |
|---|---|---|
St |
0.164 | Williamson (1988) |
CD (mean) |
1.35 | Henderson (1995) |
CL amplitude |
0.33 | Williamson (1996) |
The literature values correspond to unbounded, incompressible flow. The simulation uses a compressible solver at M=0.05 in a finite domain, so a small offset from these values is expected.
18.4 Simulation Conditions
| Item | Setting |
|---|---|
| Geometry | Circular cylinder, D=1 m |
| Analysis | Unsteady, laminar, compressible Navier–Stokes (ideal gas) |
Re_D |
100 (mu=0.2081 is used to match Re_D) |
| Mach | 0.05 |
| Reference state | ISA sea level — P=101325 Pa, T=288.15 K → rho=1.2215, U=17.0389 m/s |
| Reference area | D·dz = 0.1 (one-cell-thick extrusion, dz=0.1) |
| Total simulated time | 40 s (convective time t* = tU/D ≈ 682, about 113 shedding cycles) |
| Readout window | t = 20→40 s (55 periods), see Readout Window |
18.5 Mesh
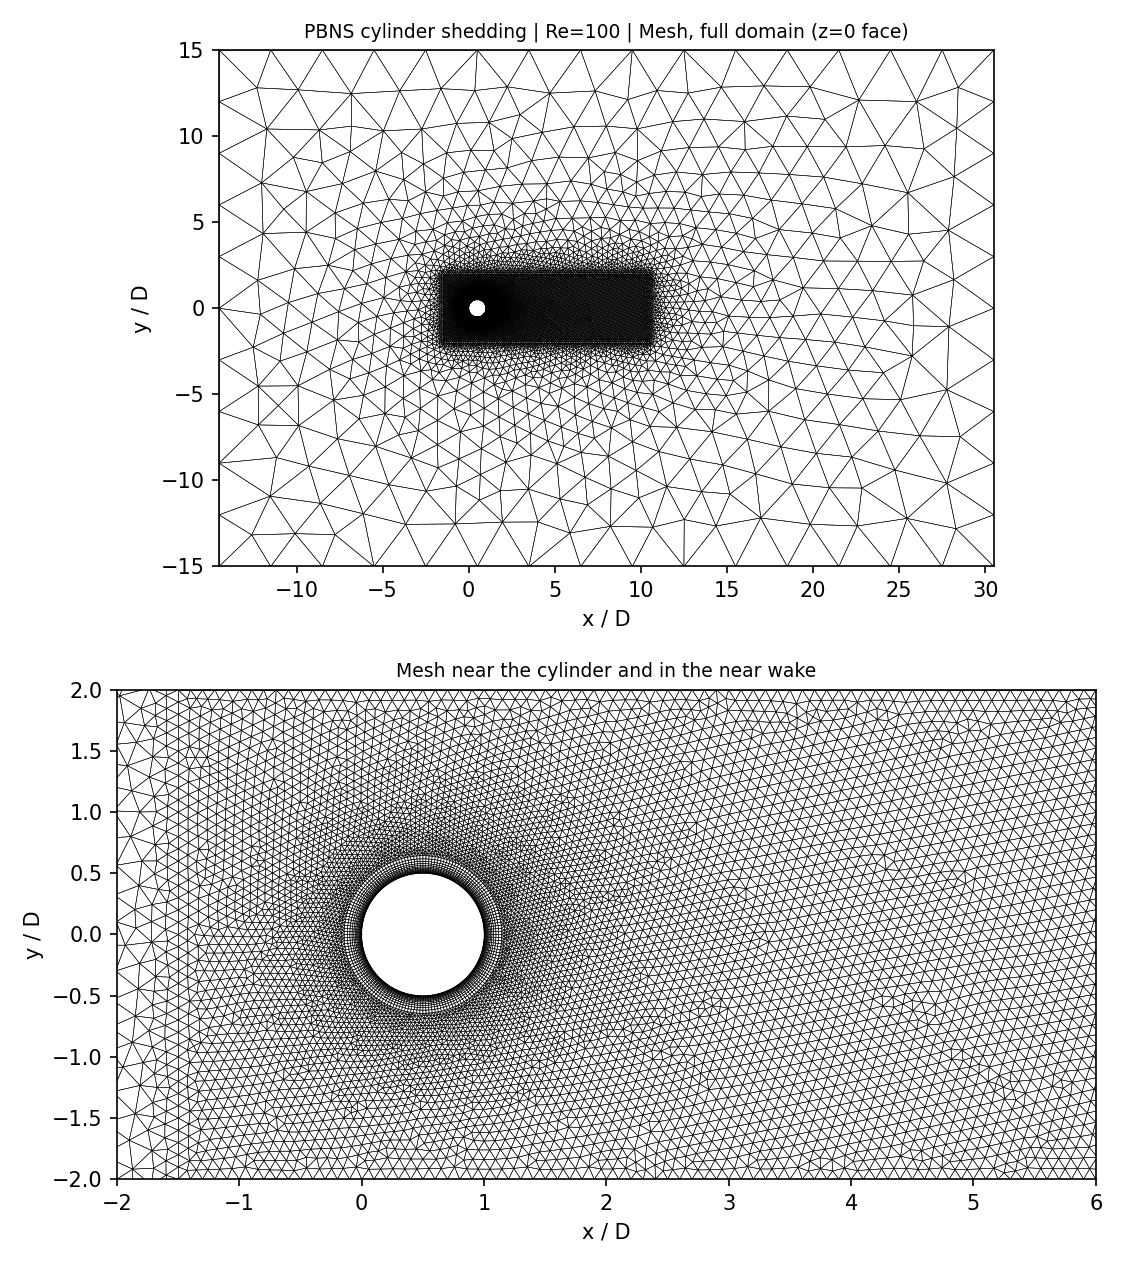
| Item | Value |
|---|---|
| Points | 26,606 |
| Elements | 21,596 prisms (triangular base) + 2,400 hexahedra |
| Extrusion | One cell in the spanwise direction, dz = 0.1 |
| Domain | 15D upstream, 30D downstream, ±15D lateral |
| Blockage | 3.33% (D / lateral extent) |
| Wake resolution | about D/15 in the near wake, about D/7 for x > 10D |
The solver is three-dimensional, so the two-dimensional planar mesh is extruded by one cell and both spanwise faces are symmetry planes. Every point then lies on a symmetry plane and the spanwise velocity is zero, which makes the problem mathematically two-dimensional. The spanwise force and the in-plane moments confirm this: over t ≥ 20 s the maximum of |CFz| is 3.2×10^-20, of |CMx| 5.9×10^-8, and of |CMy| 4.7×10^-8.
The blockage of 3.33% is higher than the usual guideline of about 2%. A finite lateral domain accelerates the flow past the cylinder and raises the shedding frequency and drag relative to the unbounded reference values, so the offsets reported below include this effect. No grid-convergence study was run.
18.6 Boundary and Initial Conditions
| Item | Setting |
|---|---|
| Cylinder | No-slip, adiabatic wall |
| Outer boundary | Farfield at M=0.05 |
| Spanwise faces | Symmetry |
The run starts impulsively from the uniform freestream. The initial field is not described further here.
18.7 Numerical Methods
| Item | Setting |
|---|---|
| Solver | PBNS: coupled velocity–pressure (u, v, w, p) solve with a finite-difference Newton linearization and the energy equation |
| Time integration | First-order implicit (backward Euler, BDF1) with adaptive time step, initial dt = 10^-3 s |
| Time step actually used | dt = 2.893×10^-4 s, constant for the whole run (minimum 2.750×10^-4, maximum 2.901×10^-4), T/1219 for a shedding period T = 0.3526 s |
| Linear solver | FGMRES with algebraic-multigrid preconditioner, max_iter 50, tolerance 10^-3; 2.02 iterations on average, 9 at most |
The time step is set automatically each step from CFL-type limits and stays at its limiting value; which limit was active was not separated.
18.8 Results
18.8.1 Development of the Shedding
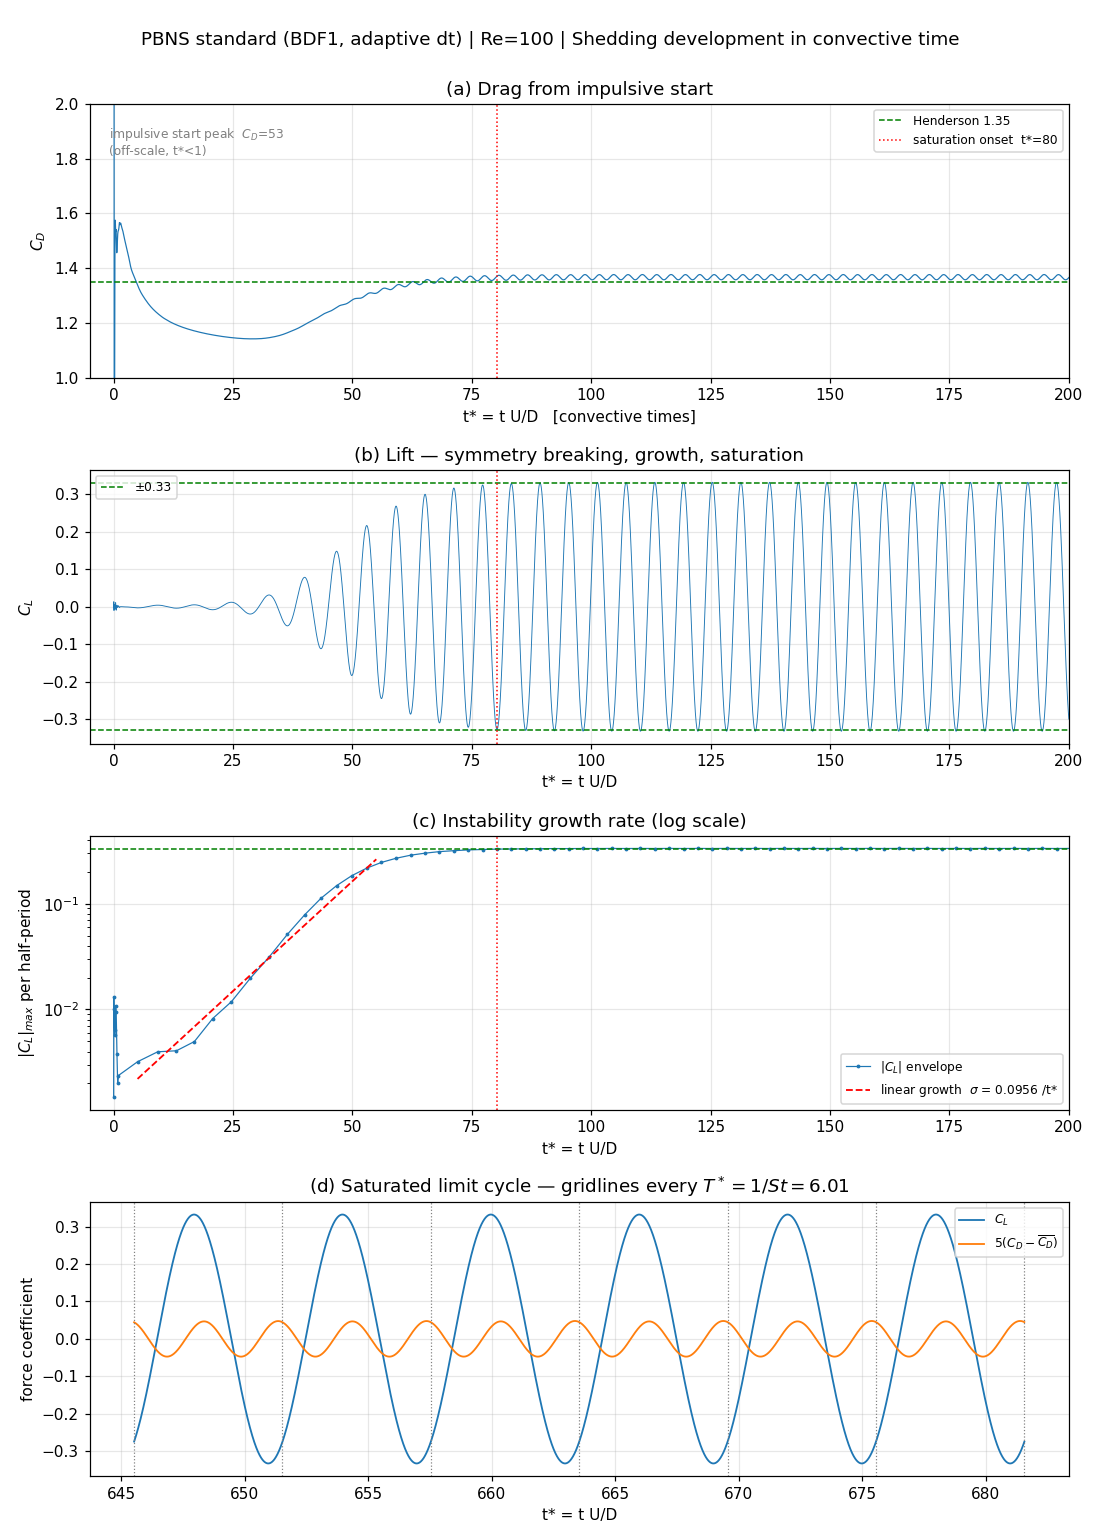
| Stage | t* |
What happens |
|---|---|---|
| Impulsive start | < 1 | CD spike of 53 (off the axis of the figure) |
| Recirculation growth | 1–30 | CD falls to 1.14 — symmetric steady wake |
| Instability growth | 5–50 | CL grows exponentially, σ = 0.0956 per t* |
| Saturation | ≈ 80 | the |CL| envelope reaches 98% of its final value |
| Limit cycle | > 80 | the readout window starts at t = 20 s (t* ≥ 341), 260 convective times after saturation |
The growth rate is a fit to the |CL| envelope between 3×10^-3 and 0.3 times the saturated value for t* > 5 (10 half-periods). It is reported, not compared with a stability analysis.
18.8.2 Readout Window
| Window start [s] | Length [s] | Periods | CD mean |
± std | CL amplitude |
St (zero crossing) |
CFx/CFy frequency ratio |
|---|---|---|---|---|---|---|---|
| 5 | 35.00 | 98 | 1.3666 | 0.0067 | 0.3323 | 0.1665 | 2.0002 |
| 10 | 30.00 | 84 | 1.3666 | 0.0067 | 0.3323 | 0.1665 | 2.0000 |
| 15 | 25.00 | 70 | 1.3666 | 0.0067 | 0.3323 | 0.1665 | 2.0000 |
| 20 | 20.00 | 55 | 1.3666 | 0.0067 | 0.3323 | 0.1665 | 2.0001 |
| 25 | 15.00 | 41 | 1.3666 | 0.0067 | 0.3323 | 0.1665 | 2.0000 |
| 30 | 10.00 | 27 | 1.3666 | 0.0067 | 0.3323 | 0.1665 | 2.0000 |
The four reported digits are fixed from a window start of 5 s on, because saturation ends at about 4.7 s (t* ≈ 80). The window used for the reported values starts at 20 s. St is evaluated from the zero crossings of CL (the coefficient of variation of the period is 0.000%).
18.8.3 Comparison with Literature
| Quantity | Wake CFD (PBNS) | Literature | Difference |
|---|---|---|---|
St (zero crossing) |
0.1665 | 0.164 (Williamson 1988) | +1.5% |
CD (mean) |
1.3666 ± 0.0067 | 1.35 (Henderson 1995) | +1.2% |
CL amplitude |
0.3323 | 0.33 (Williamson 1996) | +0.7% |
CFx/CFy frequency ratio |
2.0001 | 2 (physical requirement) | +0.005% |
All three quantities are within 1.5% of the literature values, with St and CD slightly high. This is the direction expected from the finite blockage (3.33%) and the compressibility at M=0.05; neither effect was separated by a domain or Mach-number sweep.
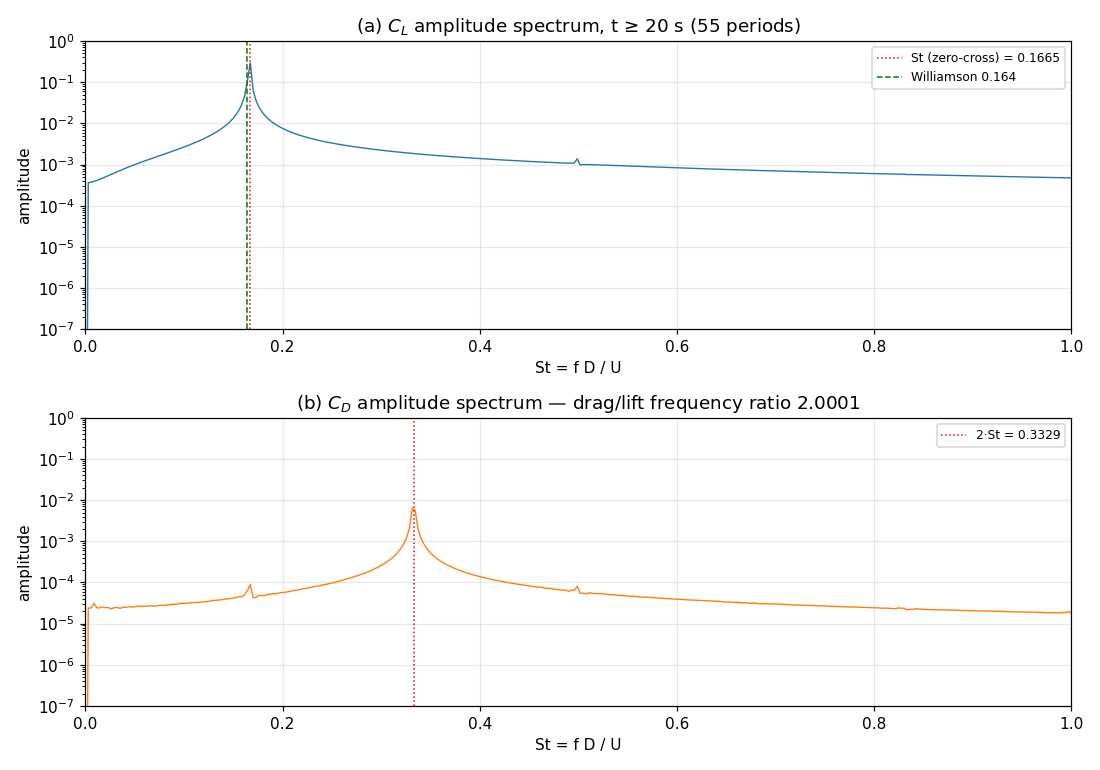
The lift peaks at 2.8365 Hz and the drag (zero crossing) at 5.6732 Hz, a ratio of 2.0001. The largest FFT bin gives St = 0.1673; the bin width of the 20 s window is df/f = 1.76%, so this agrees with the zero-crossing value within the bin uncertainty of ±0.9%. The zero-crossing value is the one reported.
18.8.4 Pressure and Friction Drag
CD |
= pressure | + friction | Friction share | |
|---|---|---|---|---|
| Wake CFD (PBNS) | 1.3666 | 1.0224 | 0.3442 | 25.2% |
| Literature | 1.35 | ≈ 1.02 | ≈ 0.33 | ≈ 24% |
Both components agree with the literature separately, which is a stronger statement than agreement of the total drag.
18.8.5 Flow Field
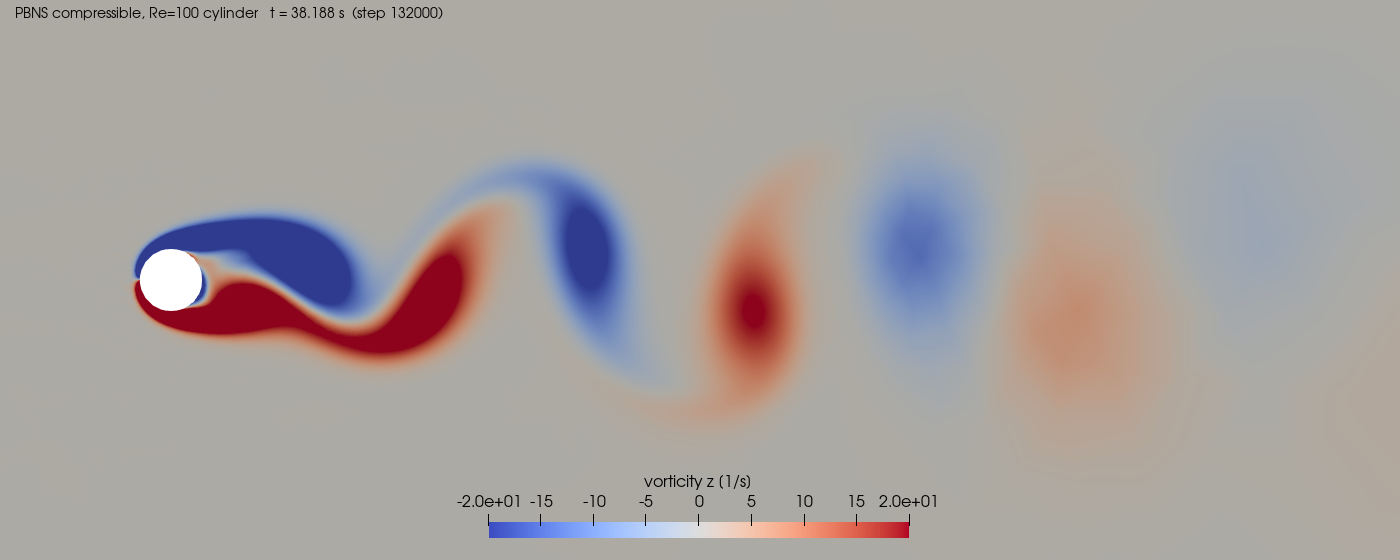
The Kármán vortex street is visible to about 14D downstream. The cores spread quickly downstream because the mid-wake resolution of this mesh (D/15, D/7 for x > 10D) is coarse.
The vorticity is not a solver output field. The PBNS volume output does not write gradient-derived fields, so the vorticity shown was computed in post-processing from the solver’s velocity field with a gradient filter.
18.9 Conclusions and Applicable Scope
- The compressible PBNS solver reproduces the laminar vortex street at
Re_D=100:St0.1665 (+1.5%), meanCD1.3666 (+1.2%), andCLamplitude 0.3323 (+0.7%) against literature, with a drag-to-lift frequency ratio of 2.0001. - The pressure and friction parts of the drag agree with the literature separately (friction share 25.2%).
- The run reached the saturated limit cycle by
t* ≈ 80; the reported values are stable against the choice of readout window start from 5 s to 30 s. - A one-cell-thick extrusion with symmetry planes behaves as a two-dimensional problem (spanwise force
≈ 10^-20).
What this case does not establish.
- No cross-check against the density-based solver. The density-based reference runs (case-08, case-04) use different meshes (case-08 has 1.67% blockage), so differences of the order of 1% in
CDandStcannot be attributed to the solver rather than the mesh. - Grid convergence and time-step convergence were not performed. The time integration is first order (BDF1) at a single time step; the effect of the time step on the result was not measured in this case.
- The offsets from the literature are not attributed. The finite blockage (3.33%) and the compressibility at
M=0.05are the candidates; no domain or Mach-number sweep was run. - The constant-density (incompressible) formulation is not covered. The constant-density input for this case diverges in the current build, so only the compressible formulation produced a result.
- Results apply to one Reynolds number (
Re_D=100), one mesh, and one time-integration scheme.
This case shows that the compressible PBNS solver captures the frequency, mean drag, and lift amplitude of laminar vortex shedding at Re_D=100 to within 1.5% of the literature values on one mesh. It establishes a baseline for this condition, not an absolute accuracy guarantee.
18.10 References
- Williamson, C. H. K., “Defining a Universal and Continuous Strouhal–Reynolds Number Relationship for the Laminar Vortex Shedding of a Circular Cylinder,” Physics of Fluids, 31(10), 1988, pp. 2742–2744.
- Henderson, R. D., “Details of the Drag Curve near the Onset of Vortex Shedding,” Physics of Fluids, 7(9), 1995, pp. 2102–2104.
- Williamson, C. H. K., “Vortex Dynamics in the Cylinder Wake,” Annual Review of Fluid Mechanics, 28, 1996, pp. 477–539.