24 3D High-Lift Trap Wing — HiLiftPW-1 Configuration 1 Validation
Lift, drag, moment, and surface pressure from α=6° to 34°, and whether the stall is found (SA-neg, against the NASA LaRC 14×22 ft experiment)
24.1 Run Provenance and Artifacts
| Item | Value |
|---|---|
| Wake CFD baseline version | 0.23.0 |
| Solver | DBNS |
| Compute device | GPU (NVIDIA RTX A6000) |
| Parallel execution | 4 MPI ranks |
| Arithmetic precision | Not recorded |
| Run date | 2026-10-15 |
Results depend on the solver build that produced them. Read every figure in this report together with the version and date above — re-running the same input on a later build may give different numbers.
24.1.1 Downloadable Files
Not available: standalone input decks and solver result files have not yet been published for download.
24.2 Validation Objective
The NASA Trap Wing is the geometry of the 1st AIAA High Lift Prediction Workshop (HiLiftPW-1): a swept, tapered wing with slat, main element and flap, tested in the NASA Langley 14×22 ft wind tunnel. Configuration 1 (slat 30°, flap 25°) is a landing-type setting. Near maximum lift the flow combines slat and flap wakes merging with the main-element boundary layer, a wing-tip vortex, and the onset of massive separation, which makes it a demanding steady RANS case.
This report compares Wake CFD with the experiment from α=6° to α=37°, with two questions:
- Does Wake CFD reproduce the lift, drag, pitching moment, and surface pressure up to maximum lift (
α≈32–34°)? - Does it find the stall — the abrupt loss of lift after maximum lift (in the experiment, near
α≈36°)? Values after the stall are not treated as reliable; the question is only whether the stall is found or not.
Only Configuration 1 is reported here.
24.3 Reference Solution and Data
| Item | Setting |
|---|---|
| Experiment | NASA LaRC 14×22 ft, Test 513, Run 105 (α increasing), corrected to free air, Re≈4.6×10^6; Run 106 (α decreasing) shown for the hysteresis |
| Comparison band | 95% repeatability interval over three test campaigns (’98, ’02, ’03) |
24.4 Simulation Conditions
| Item | Setting |
|---|---|
| Geometry | NASA Trap Wing, Configuration 1 (slat 30° / flap 25°), half model, free air; the mesh appears to contain no support bracket (not checked directly) |
| Analysis | Steady, compressible DBNS, RANS, fully turbulent |
| Mach / Reynolds number | M=0.2, Re_MAC=4.3×10^6, T=288.889 K |
| Reference quantities | Half-wing reference area 22.028 ft², MAC=39.634 in, moment reference at x=34.342 in (quarter MAC) |
| Angles of attack | 6°, 13°, 21°, 28°, 32°, 34°, 37° |
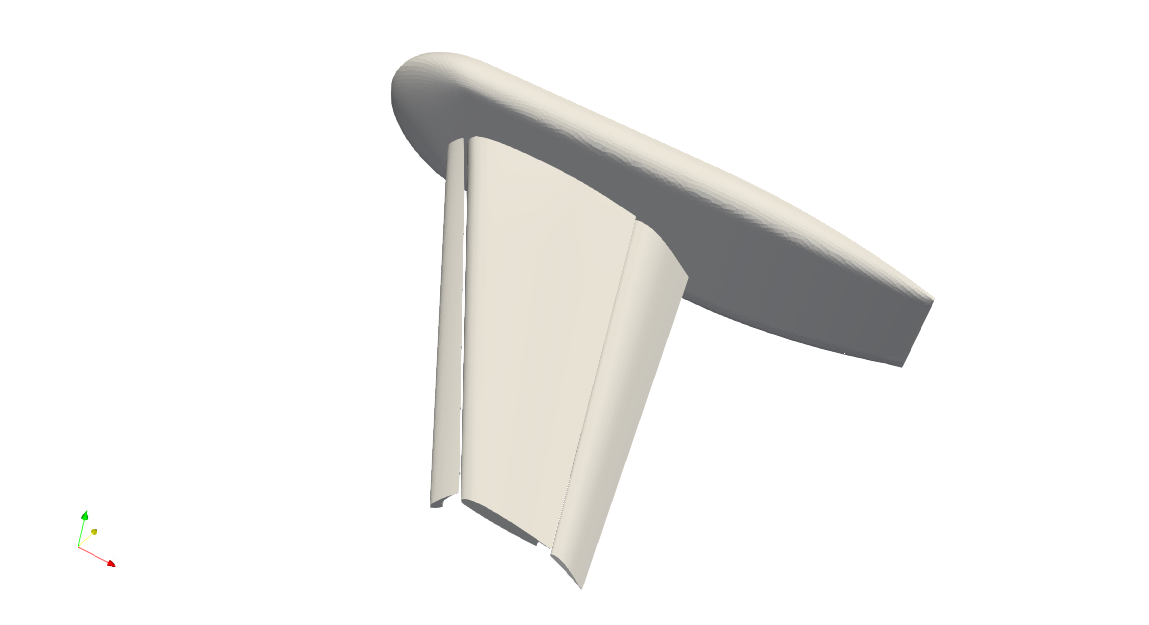
Differences from the experiment. The simulation is a free-air half model without a support bracket (as far as could be checked) and with a Reynolds number (4.3×10^6) slightly below the tunnel’s. The workshop participant band in the force chart below was read from a published figure (AIAA 2011-939, Fig. 2, 37 submissions on the medium mesh) and is an approximation, not the submitted data.
24.5 Mesh
| Item | Setting |
|---|---|
| Mesh | HiLiftPW-1 unstructured mixed mesh, from-tet, node-centered (Unst-Mixed-FromTet-Nodecentered-A-v1), Configuration 1, medium level — 11,047,965 nodes, 38,665,677 elements (tetrahedra, pyramids, prisms), used as distributed by the workshop |
24.6 Boundary and Initial Conditions
N/A: Detailed boundary-condition settings are not documented in this case.
24.6.1 Initial field and procedure
The same input was run in two ways, and the results differ at high angle of attack.
- Free-stream start. Every angle started from a uniform free-stream field (
α=6°,13°,21°, and also28°,32°,34°,37°). - Continued start. For
α=28°,32°,34°, and37°, the initial field was the converged solution of the previous angle (21° → 28° → 32° → 34° → 37°). Only the flow field was read; iteration count and CFL started from zero.
α=6°, 13°, and 21° were run from the free stream. The α=13° and 6° runs were extended beyond 10,000 iterations.
24.7 Numerical Methods
| Item | Setting |
|---|---|
| Turbulence model | SA-neg (shat_form: blend2012; ft2, QCR, rotation correction off), Pr_t=0.9, farfield nu_tilde/nu = 3 |
| Convective scheme | Roe, U-MUSCL kappa=0.5, second order |
| Gradients / limiter | Green–Gauss physical gradient, least-squares reconstruction gradient, edge-based van Albada limiter |
| Time integration | Euler implicit; FGMRES; adaptive CFL, 2 → 30 (per point); iteration limit 10,000 per angle |
24.8 Results
24.8.1 Forces and Moment
The values below are averages over the last 200 iterations, with the experimental 95% band for the same angle. Coefficients are shown to four decimals.
| α [°] | Start | CL |
CD |
CMy |
CL band |
CD band |
In band (CL / CD) |
|---|---|---|---|---|---|---|---|
| 6 | free stream | 1.5069 | 0.1987 | −0.4802 | 1.4980–1.5540 | 0.1990–0.2090 | yes / on the edge (−0.0003) |
| 13 | free stream | 1.9949 | 0.3218 | −0.4700 | 2.0140–2.0700 | 0.3270–0.3430 | no (−0.0191) / no (−0.0052) |
| 21 | free stream | 2.5167 | 0.5022 | −0.4622 | 2.5380–2.5950 | 0.5060–0.5420 | no (−0.0213) / no (−0.0038) |
| 28 | previous angle | 2.8920 | 0.6766 | −0.4438 | 2.8860–2.9420 | 0.6640–0.7130 | yes / yes |
| 32 | previous angle | 2.9887 | 0.7552 | −0.3964 | 2.9790–3.0350 | 0.7380–0.7880 | yes / yes |
| 34 | previous angle | 2.9984 | 0.7850 | −0.3621 | 2.9740–3.0310 | 0.7610–0.8100 | yes / yes |
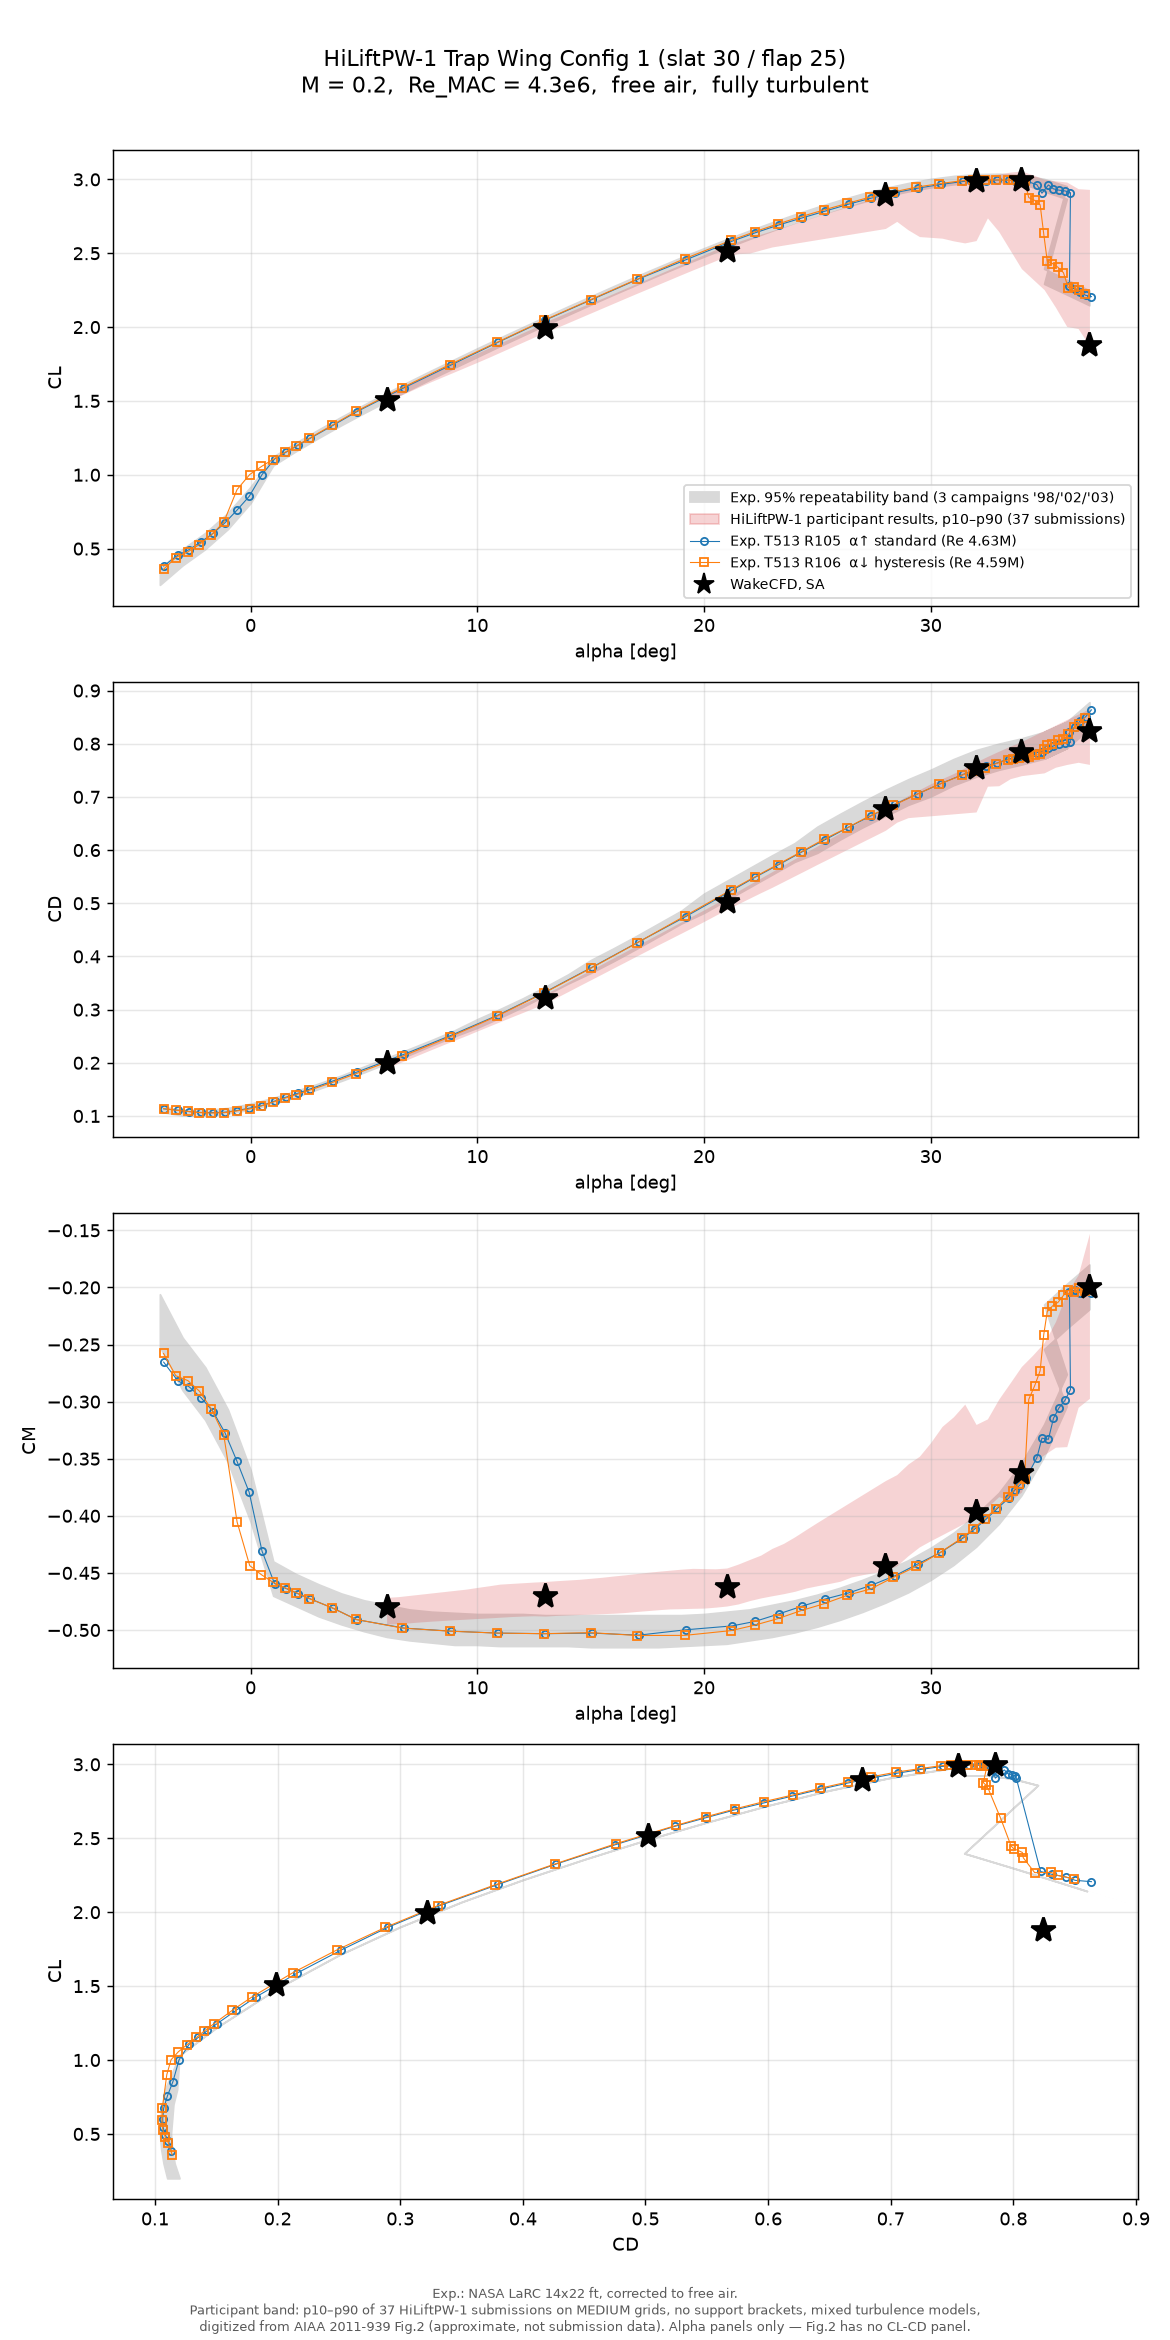
α=37° point is not a converged value (see the stall section).- Up to maximum lift the forces follow the experiment.
α=28–34°is inside the band for bothCLandCD, including the maximum-lift region (CL≈2.99–3.00atα=32–34°). - At
α=13°and21°the lift is slightly below the band (CL−0.02,CD−0.004 to −0.005). With a single mesh level it is not possible to say whether this is a mesh effect or a model effect. CMyis less negative than the experiment atα=6–21°by 0.02–0.03; the workshop participant band lies on the same side. It is not a Wake CFD-specific deviation as far as this comparison can tell.
24.8.2 Surface pressure
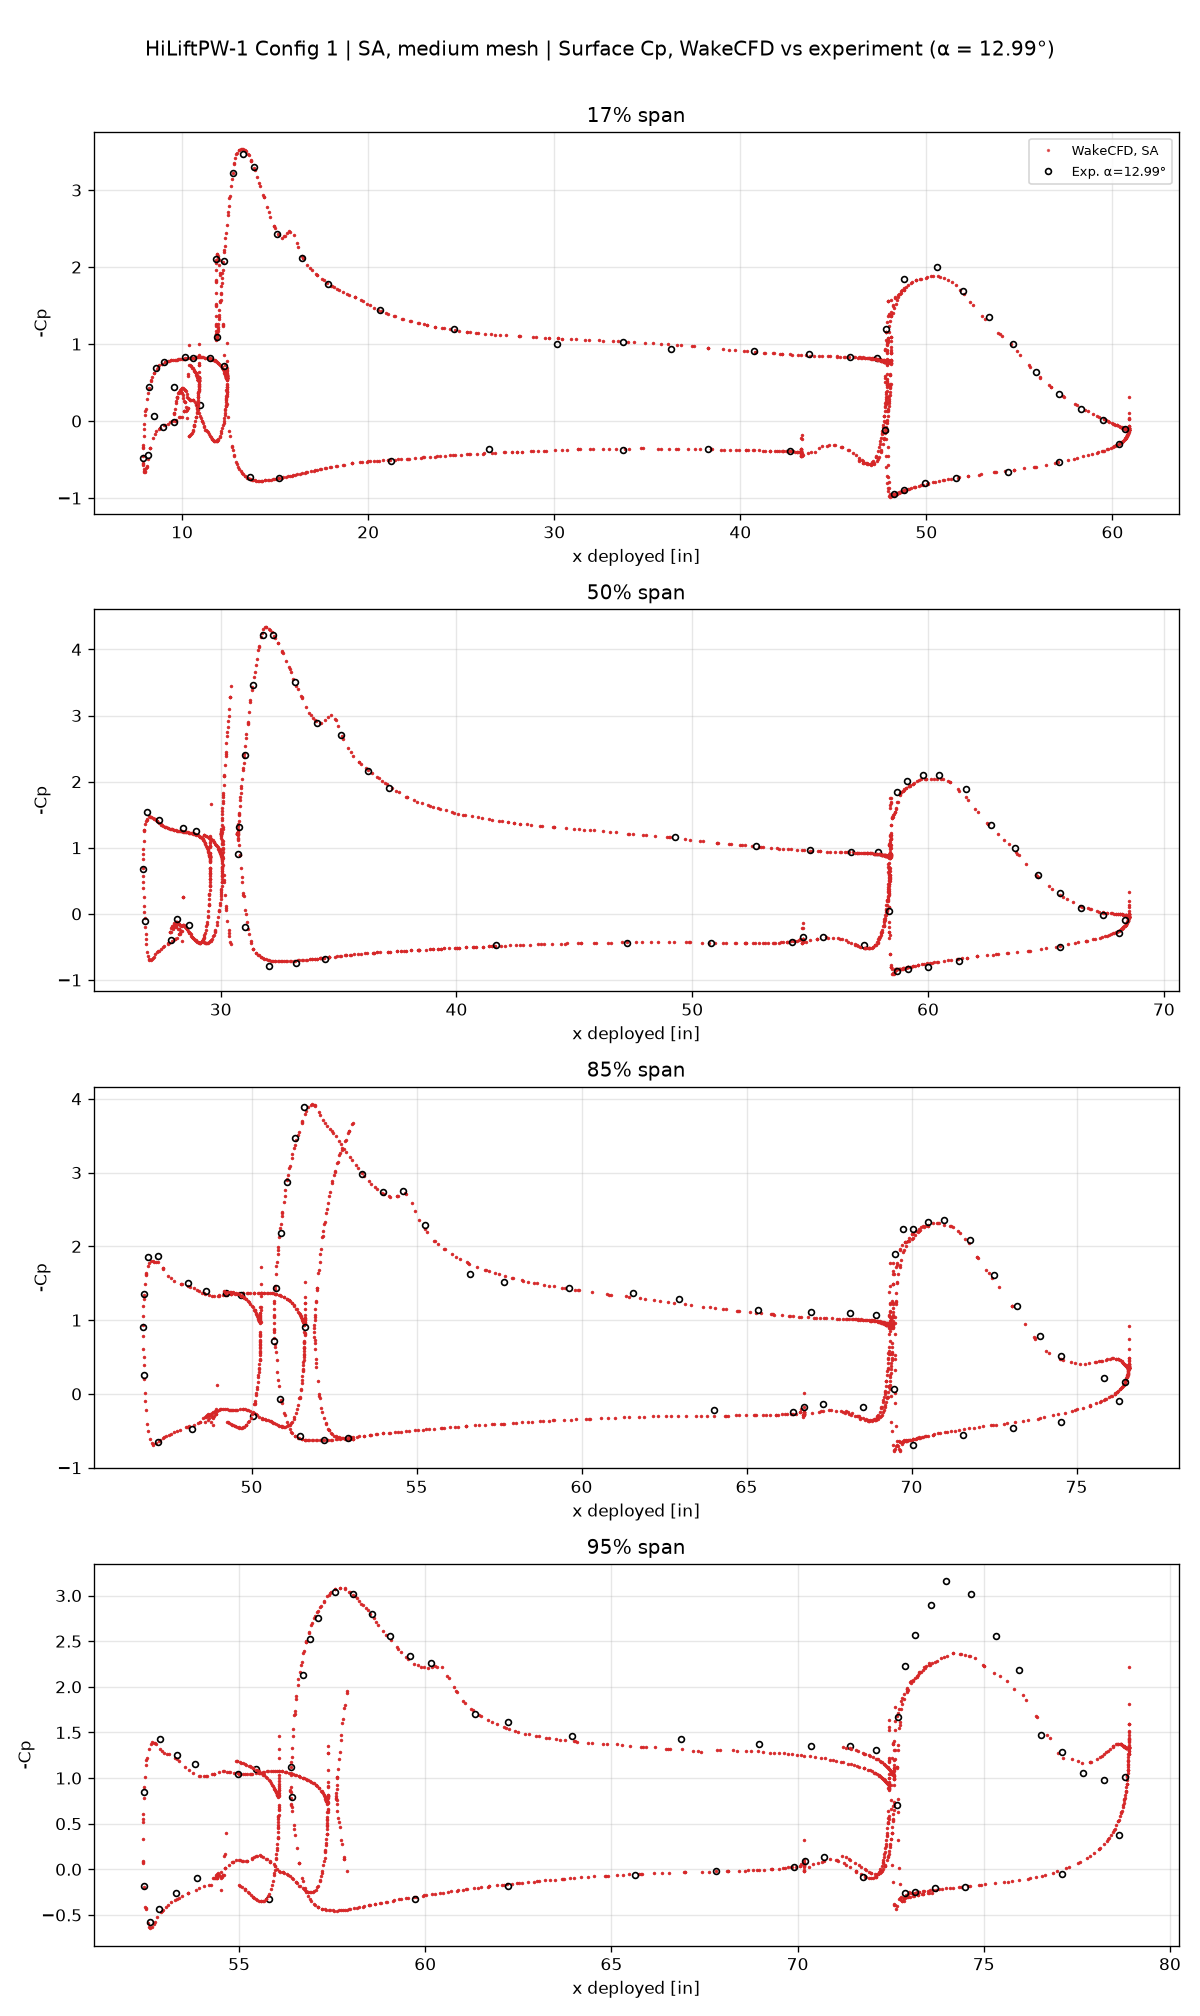
Spanwise sections at 17%, 50%, 85%, and 95% of the semi-span, against the experimental pressure taps at α=12.99°, 28.41°, 31.95°, and 33.95°.
α=13°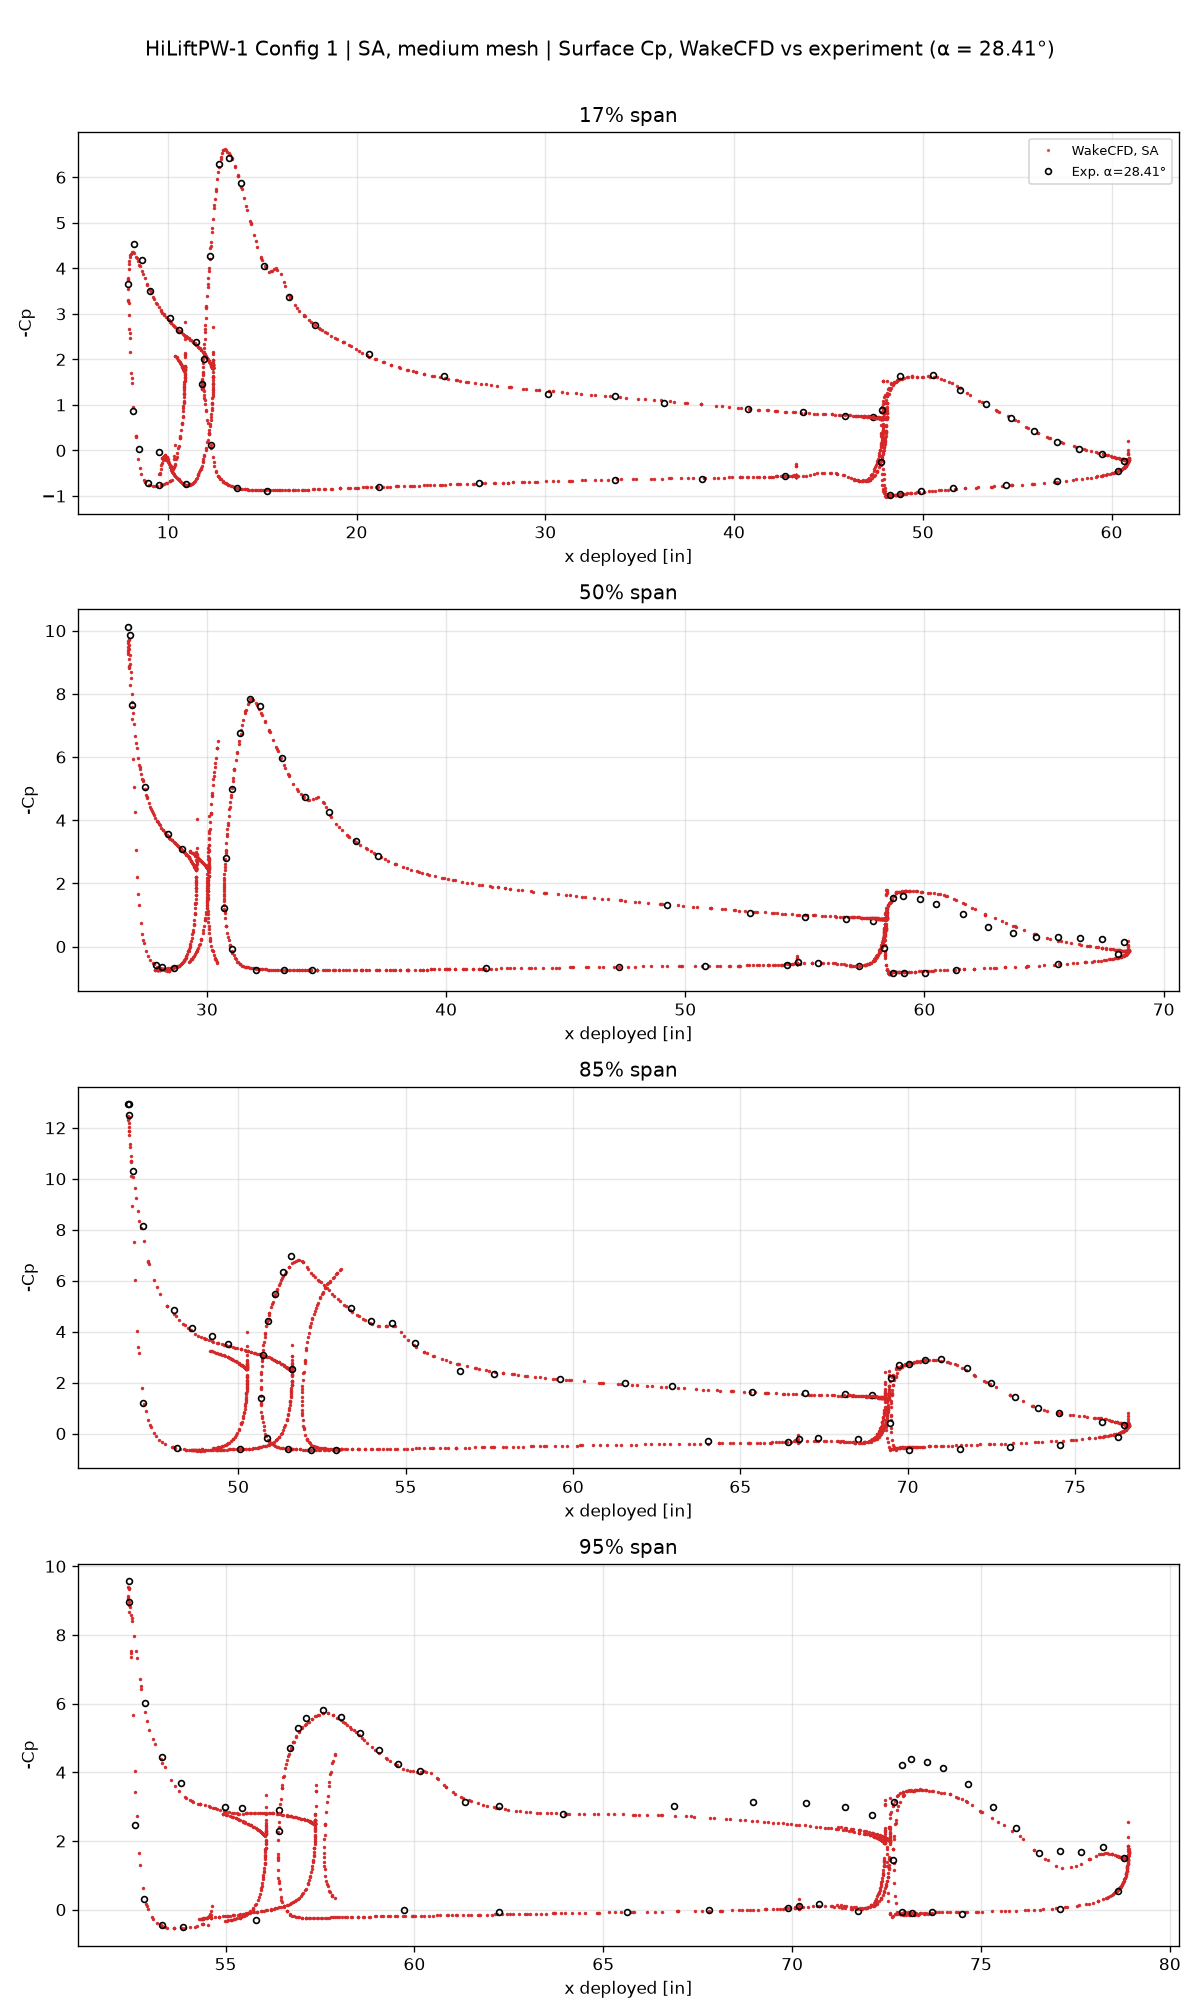
α=28°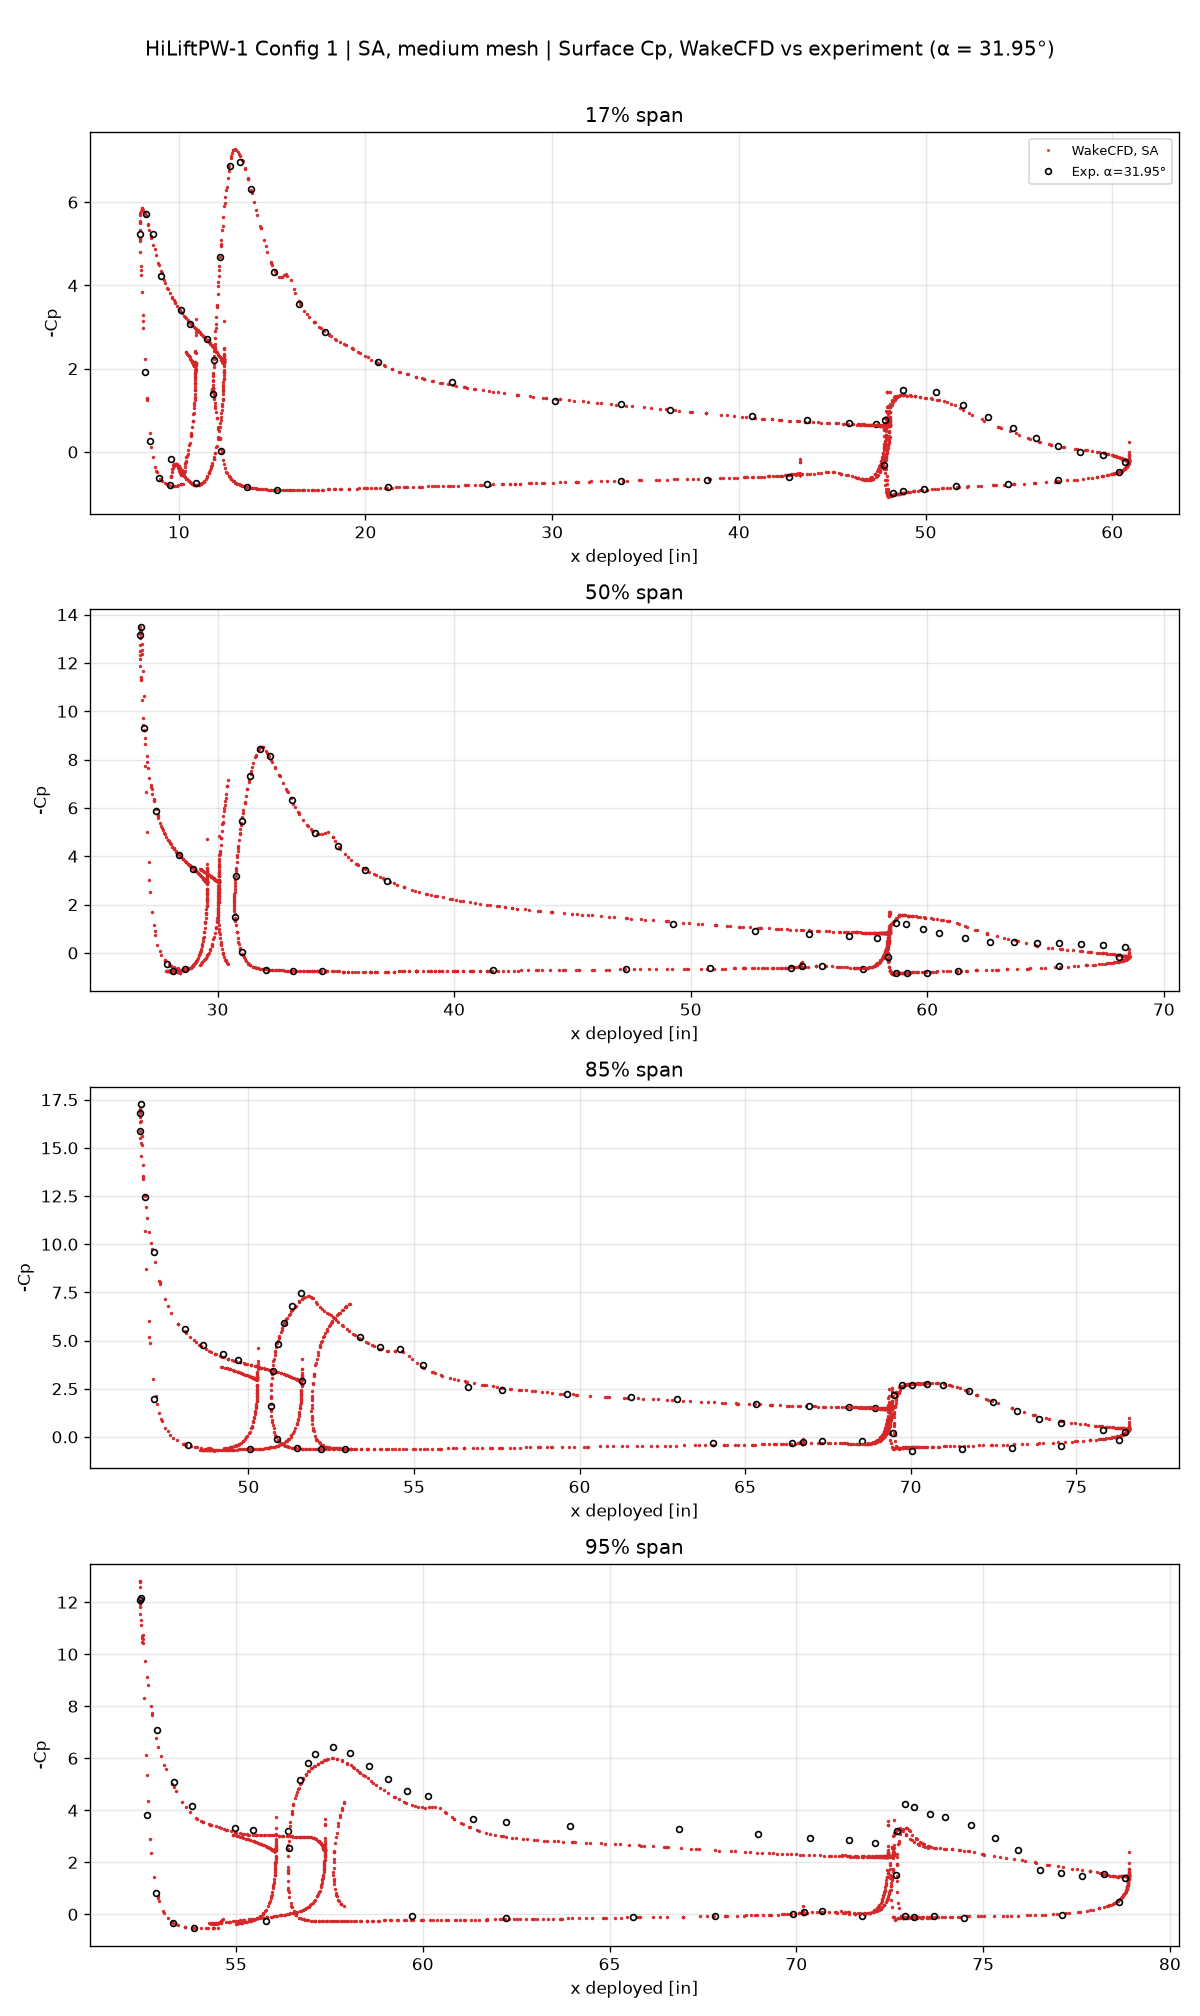
α=32°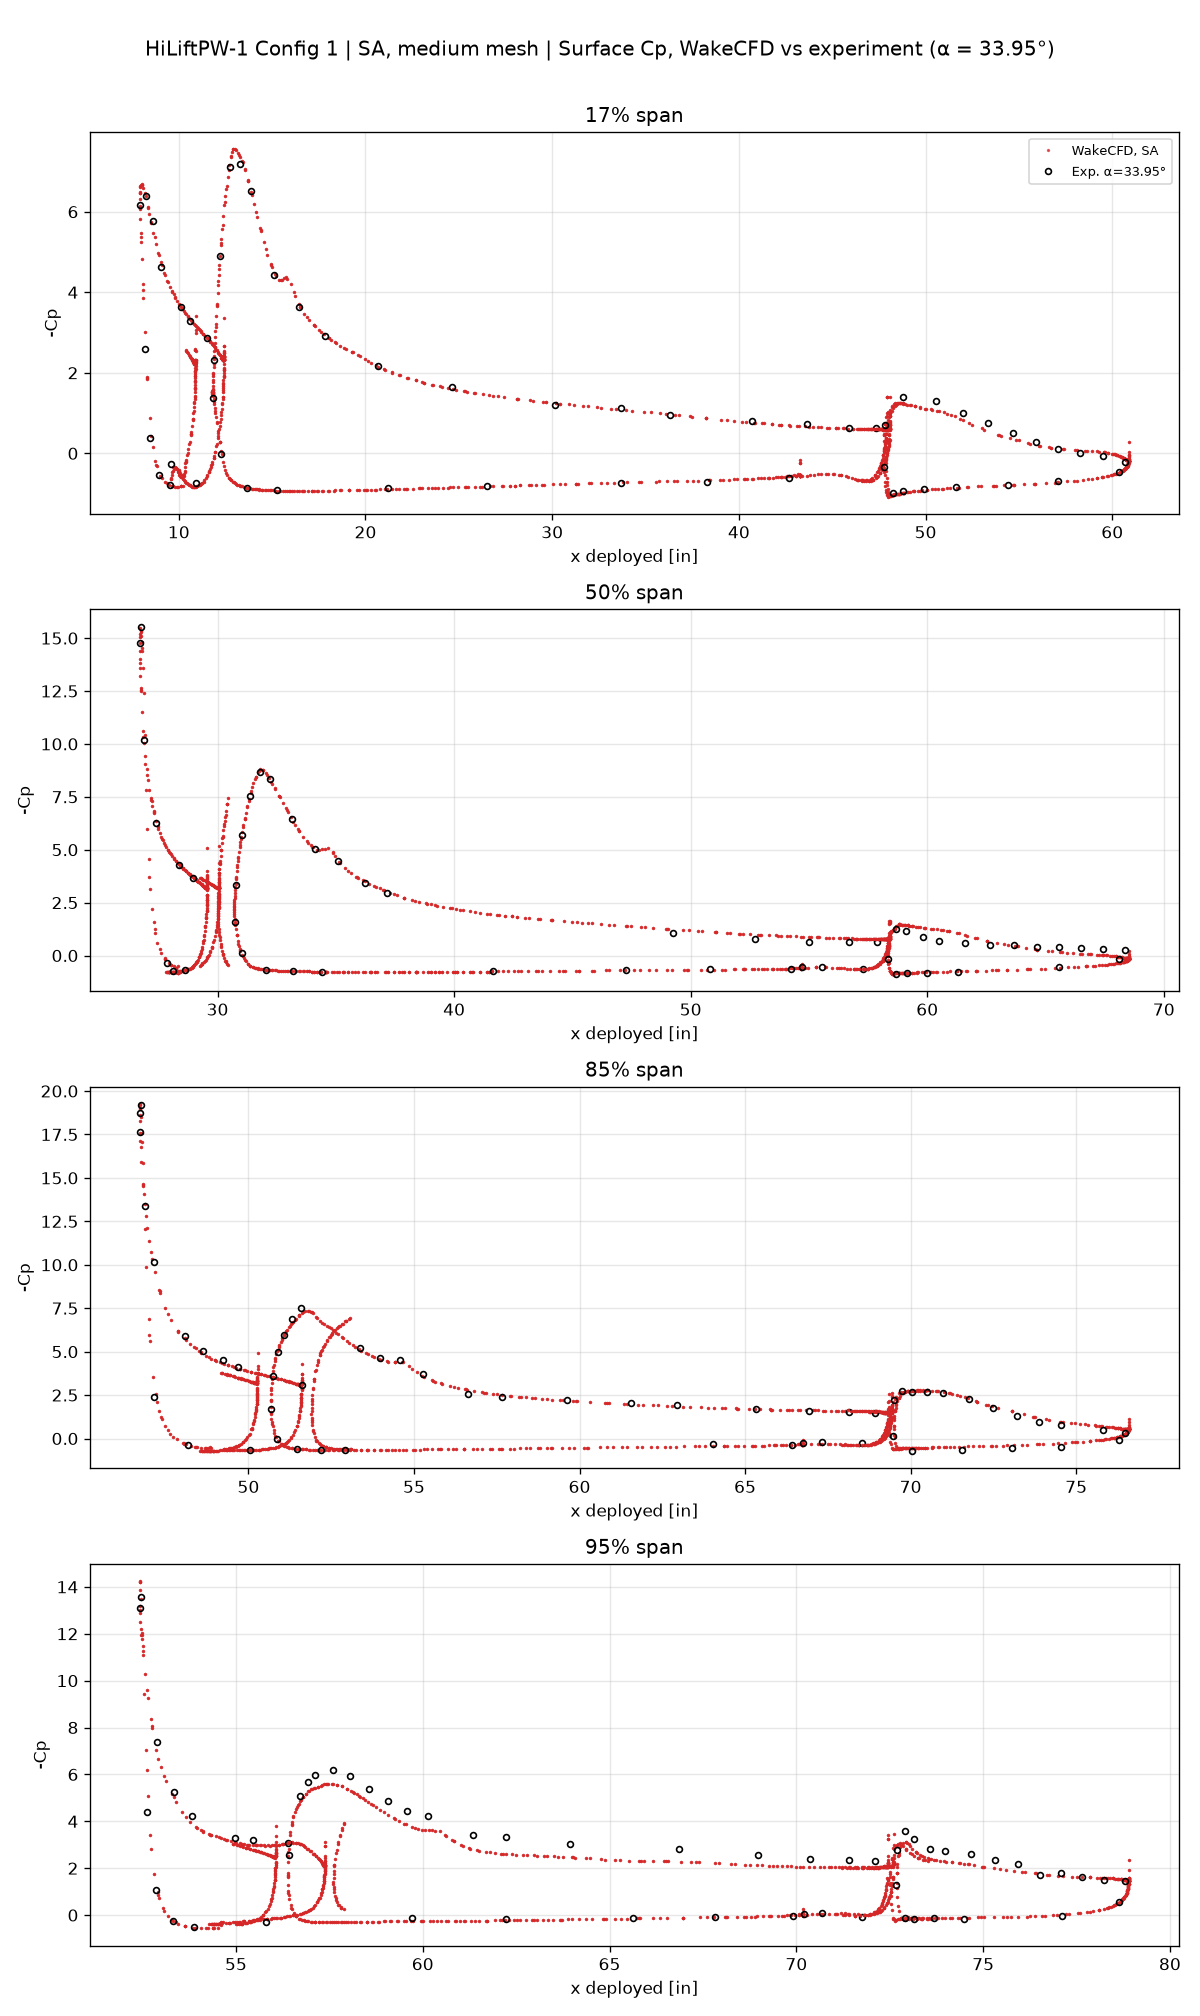
α=34°At 17%, 50%, and 85% span the slat, main-element, and flap suction peaks overlap the experimental points at all four angles. At 95% span (near the wing tip) the main-element and flap suction is weaker than in the experiment — at α=32° the main-element peak −Cp is about 6.0 against 6.4, and the flap peak about 3.2 against 4.2; α=34° shows the same trend. The wing-tip vortex strength or position may be predicted differently, but this was not investigated. The tangled curves where the slat and main element overlap come from the planar section cutting several elements at once and are a post-processing effect.
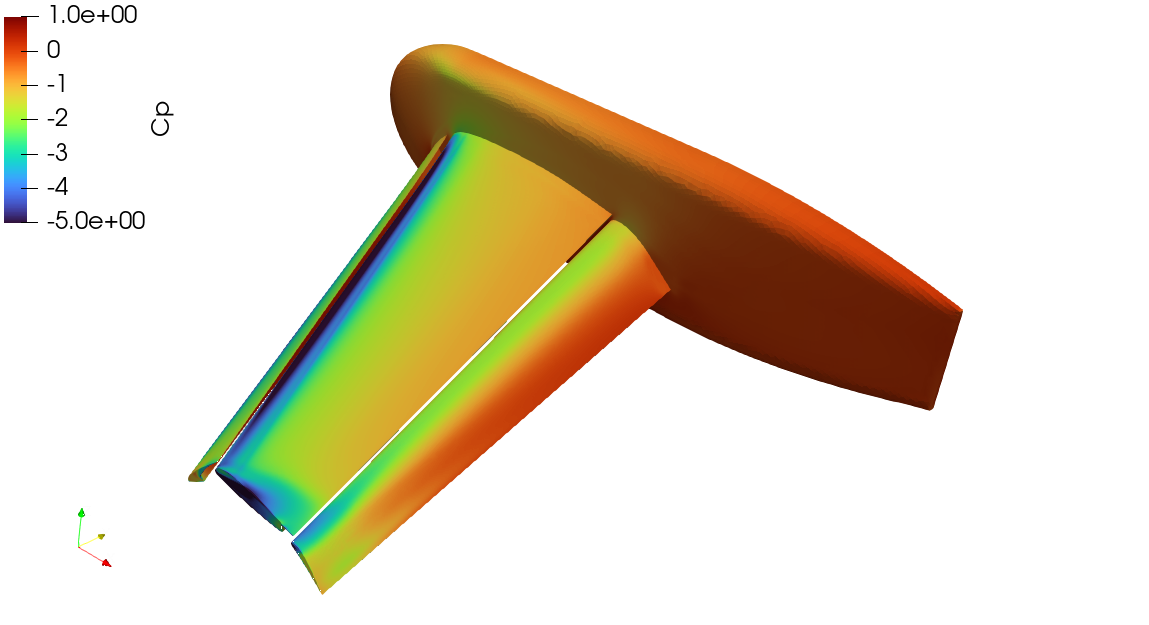
Cp at α=21° (color range −5 to 1; stronger suction is saturated)24.8.3 Is the Stall Found?
In the experiment, the lift stays near its maximum (CL≈3.0) through α≈34–35° and then drops abruptly near α≈36° (Run 105: from 2.91 to 2.28). At α=37° the experiment gives CL=2.2065, CD=0.8637.
Wake CFD maximum lift is reproduced; the stall is not established.
- Continued from the previous angle (
α=37°after34°). The solution starts attached (CL≈2.95–2.96), holds for the first 1,000–2,000 iterations, and from about iteration 3,000 the lift falls:CL=2.79(3,000),2.40(4,000),2.25(5,000),2.12(6,000),1.96(8,000),1.87(10,000). The lift drops through the experimental post-stall value (≈2.2) and keeps falling; at the end of 10,000 iterations it is still changing by about −0.036 per 1,000 iterations. This is not a steady state, so neither the stall angle nor the post-stall level (1.8787 in the chart) can be read from it. - Started from the free stream (
α≥28°). The solutions settle in a different, separated state with lift far below the experiment at the same angle:CL=2.0270at28°(band 2.886–2.942), and 1.6162 / 1.6102 / 1.5918 at32°/34°/37°. The same mesh, model, and settings give a different steady state depending on the initial field at high angle of attack. It was not determined whether the free-stream solution is a non-physical early separation caused by SA-neg and the medium mesh, or a second branch of the steady equations. The experiment shows only the attached branch atα=28°.
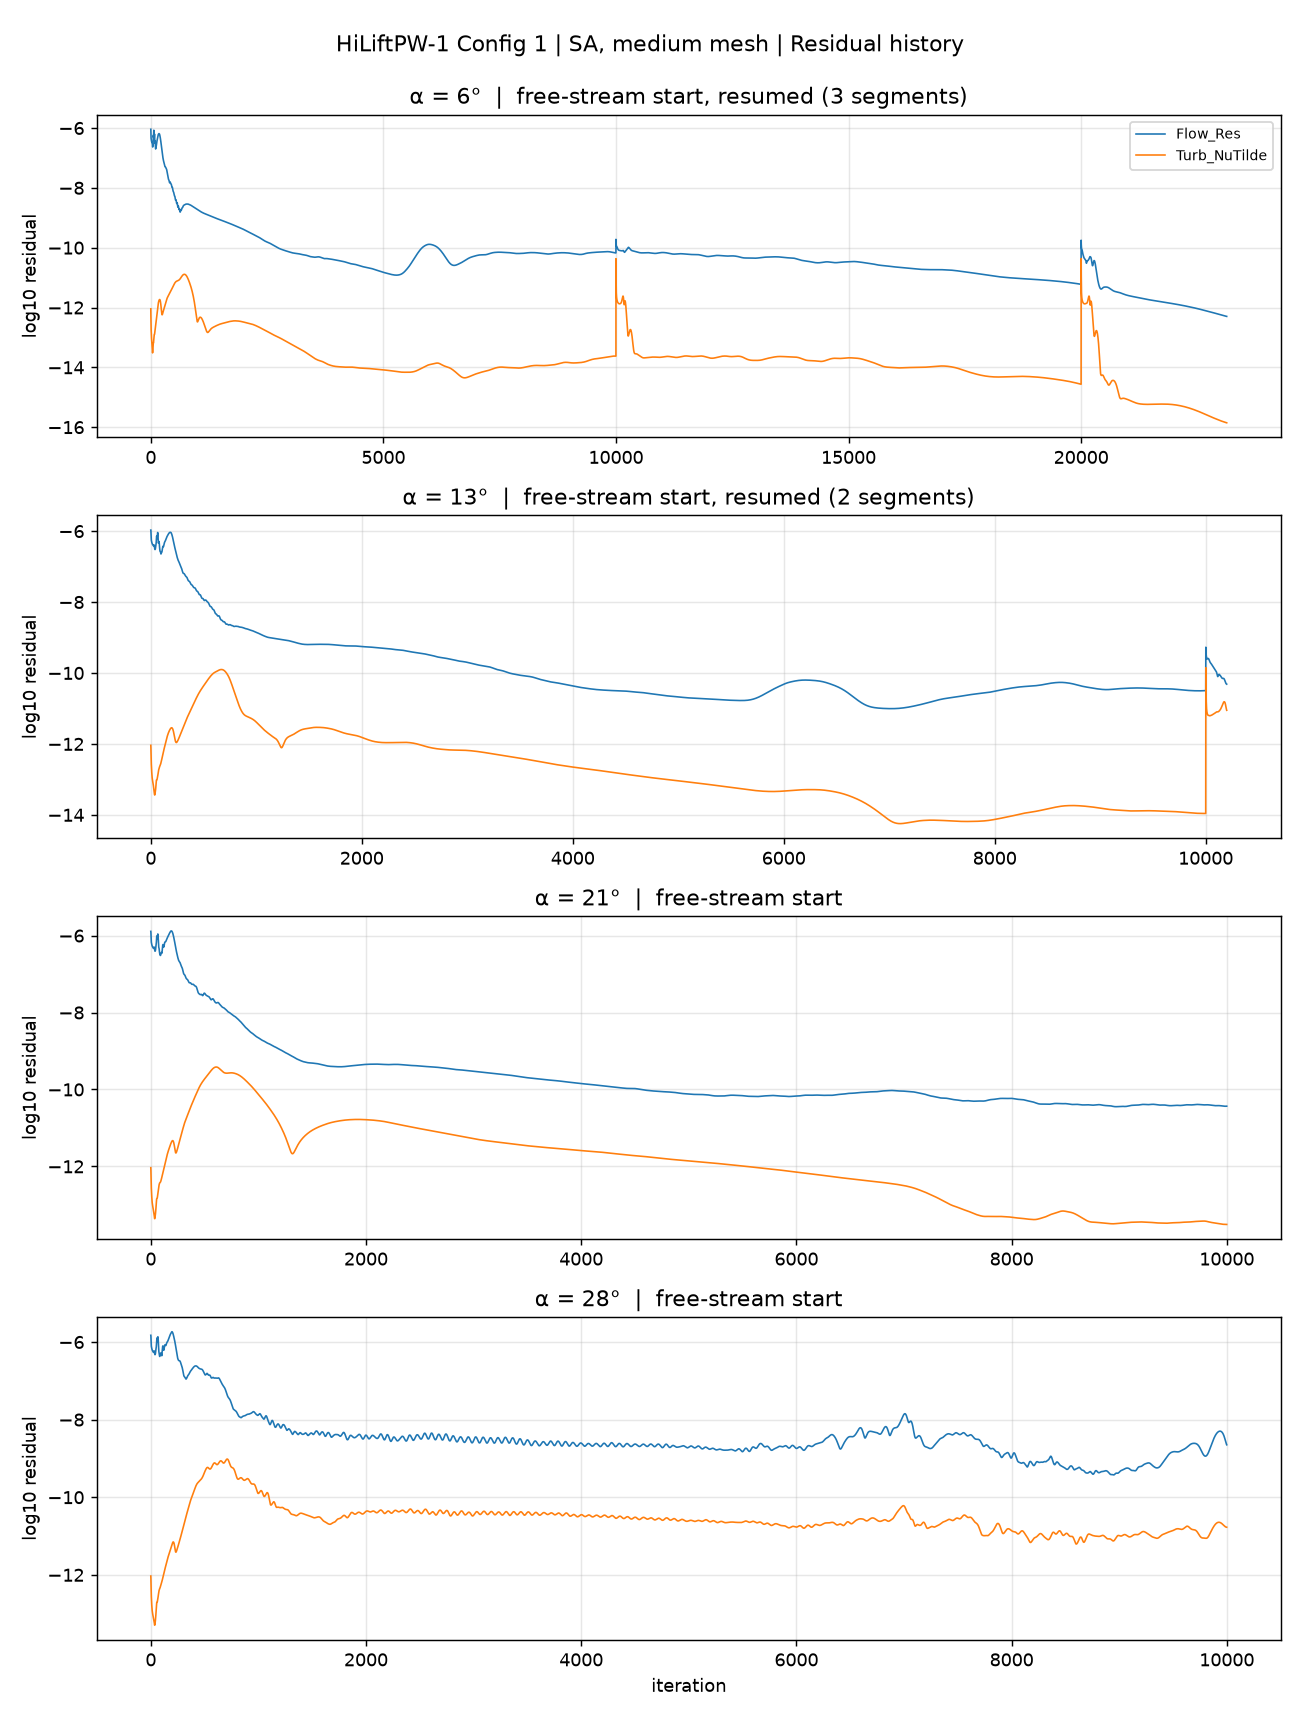
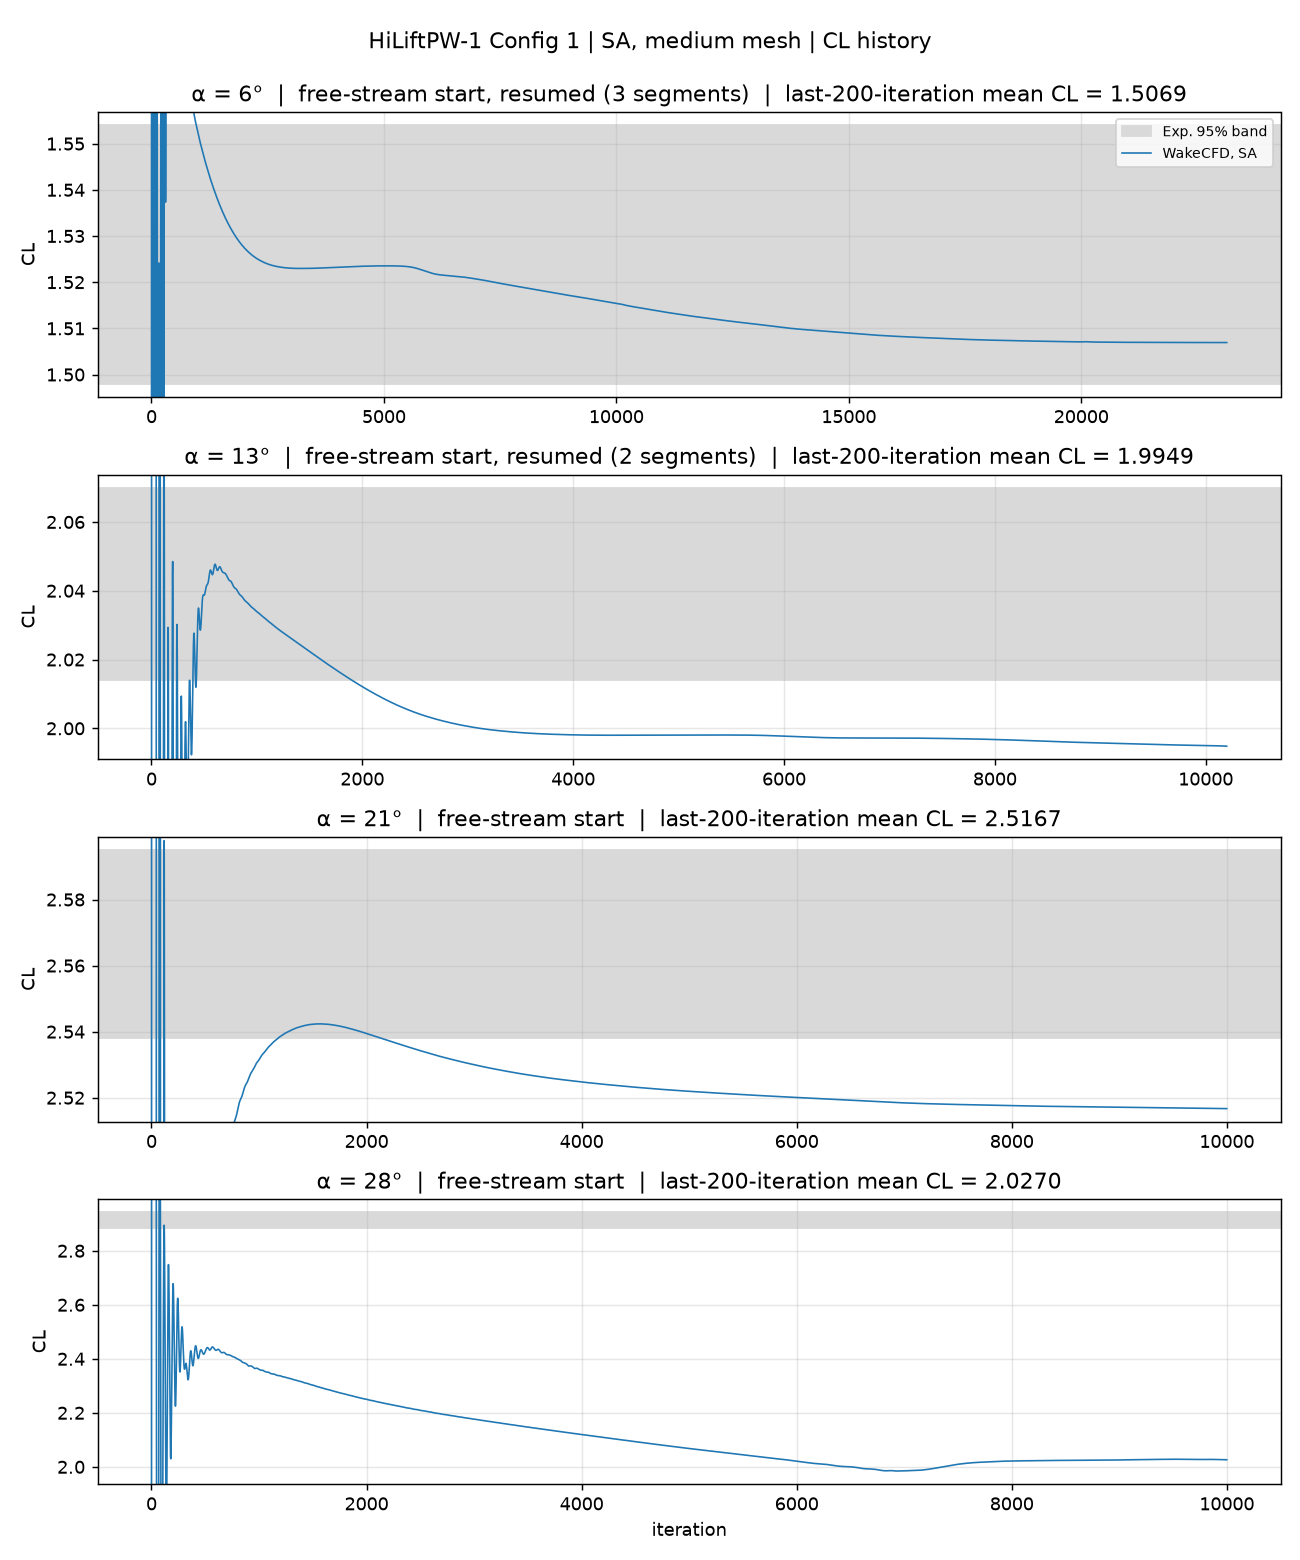
CL history, free-stream start. At α=28° the lift decreases steadily from the start and settles near 2.03.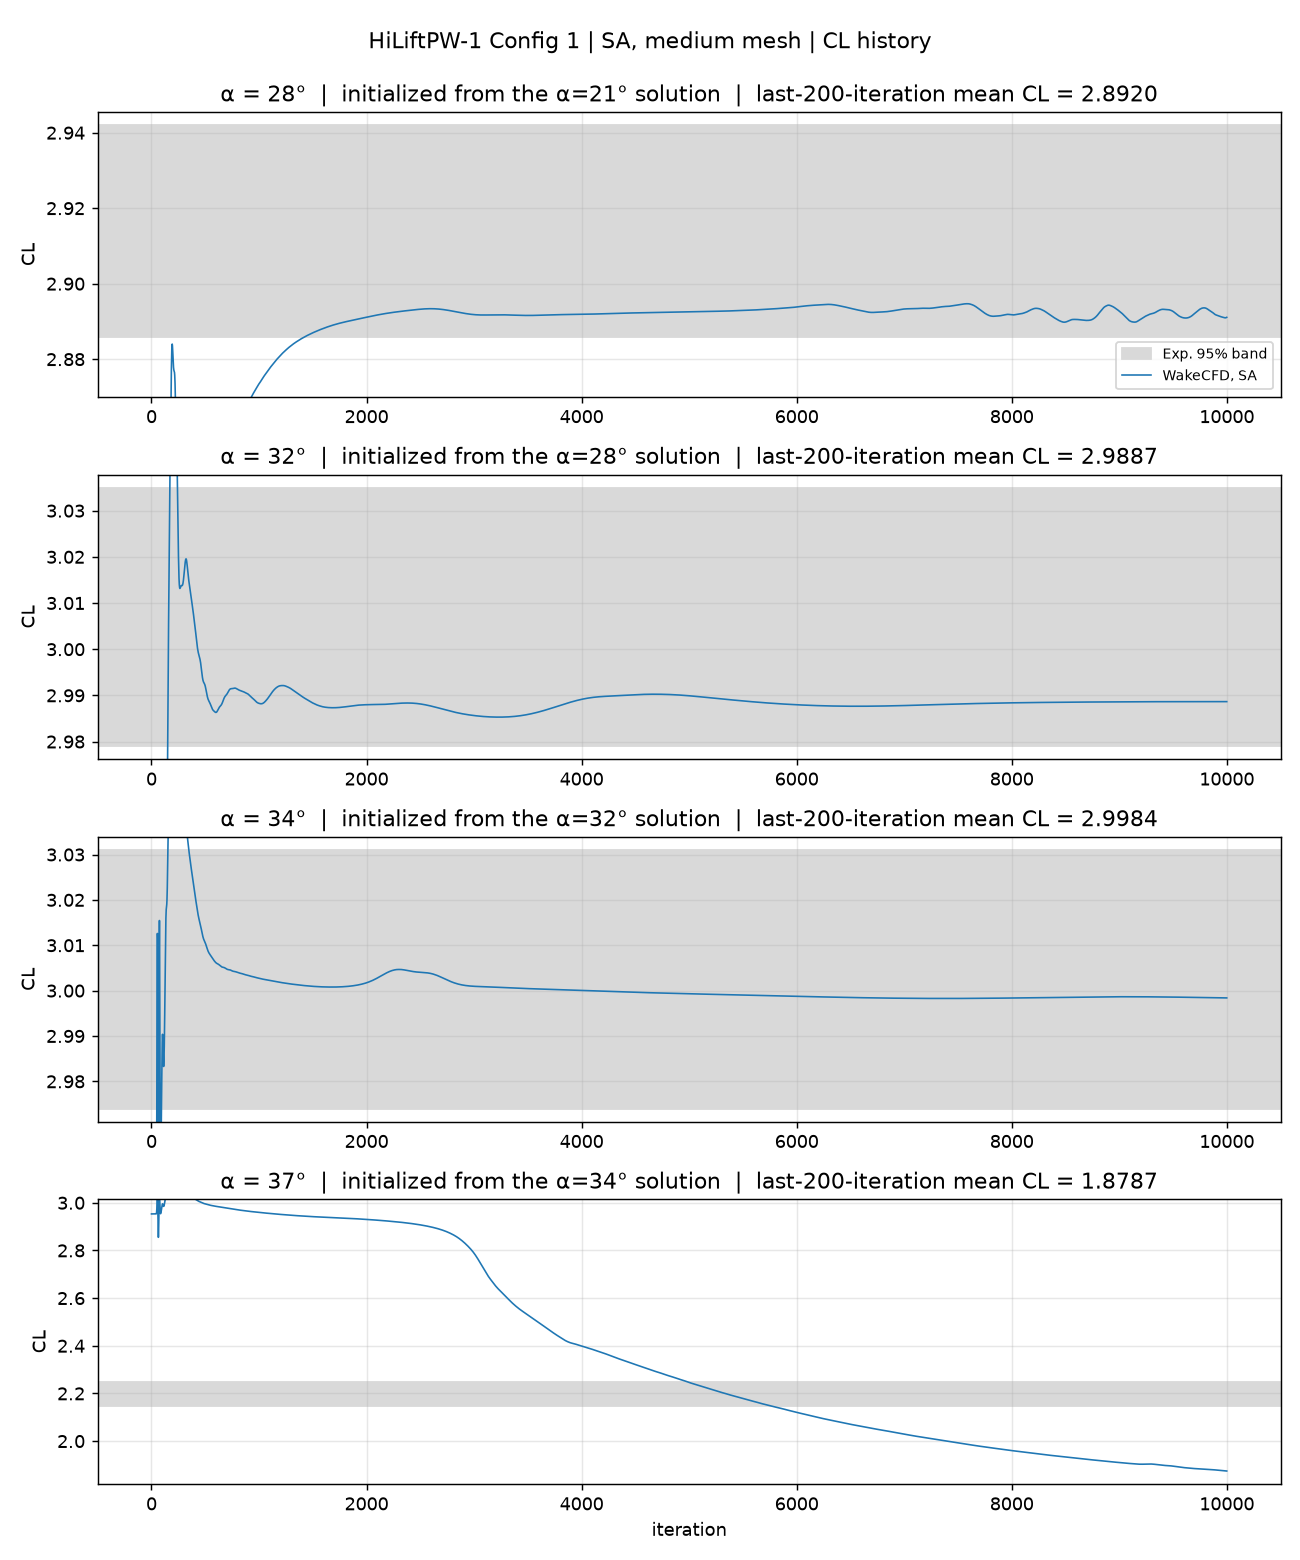
CL history, continued start. α=37° falls from about iteration 3,000 and does not settle.What can be stated. Maximum lift near α=32–34° is reproduced when the high-angle solutions are continued from the lower angle. A loss of lift does appear at α=37°, in the direction of the experimental stall, but it does not converge and it is not a prediction of the stall angle or of the lift after the stall. The experiment also shows a large hysteresis between increasing and decreasing angle near α≈36°; only the increasing-angle path was computed.
24.8.4 Convergence History
Iterative convergence was checked on the change of CL over the last 1,000 iterations: below 0.002 at α=6–34° (continued start). The flow residual finished near −10 for α=6–34° (down to −12.3 at α=6° after the extension; −8.7 at α=28° free-stream start). Residual and CFL histories are shown for each way of starting. The adaptive CFL reaches its limit of 30 within about 30–35 iterations and stays there.
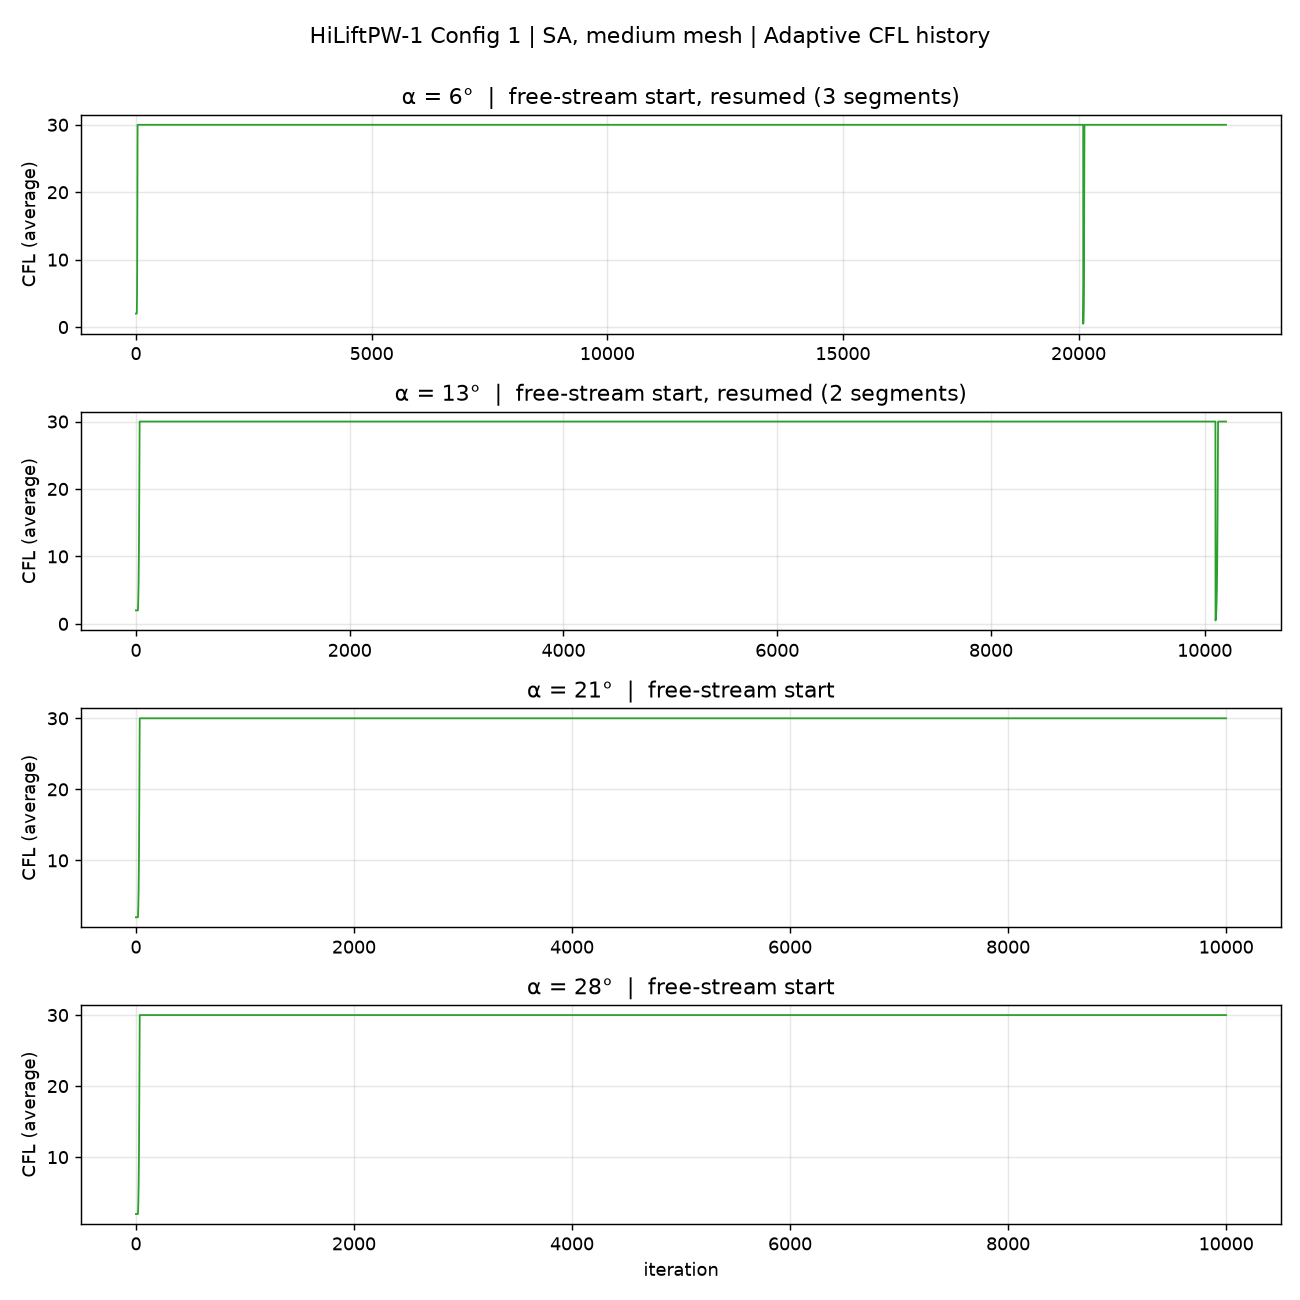
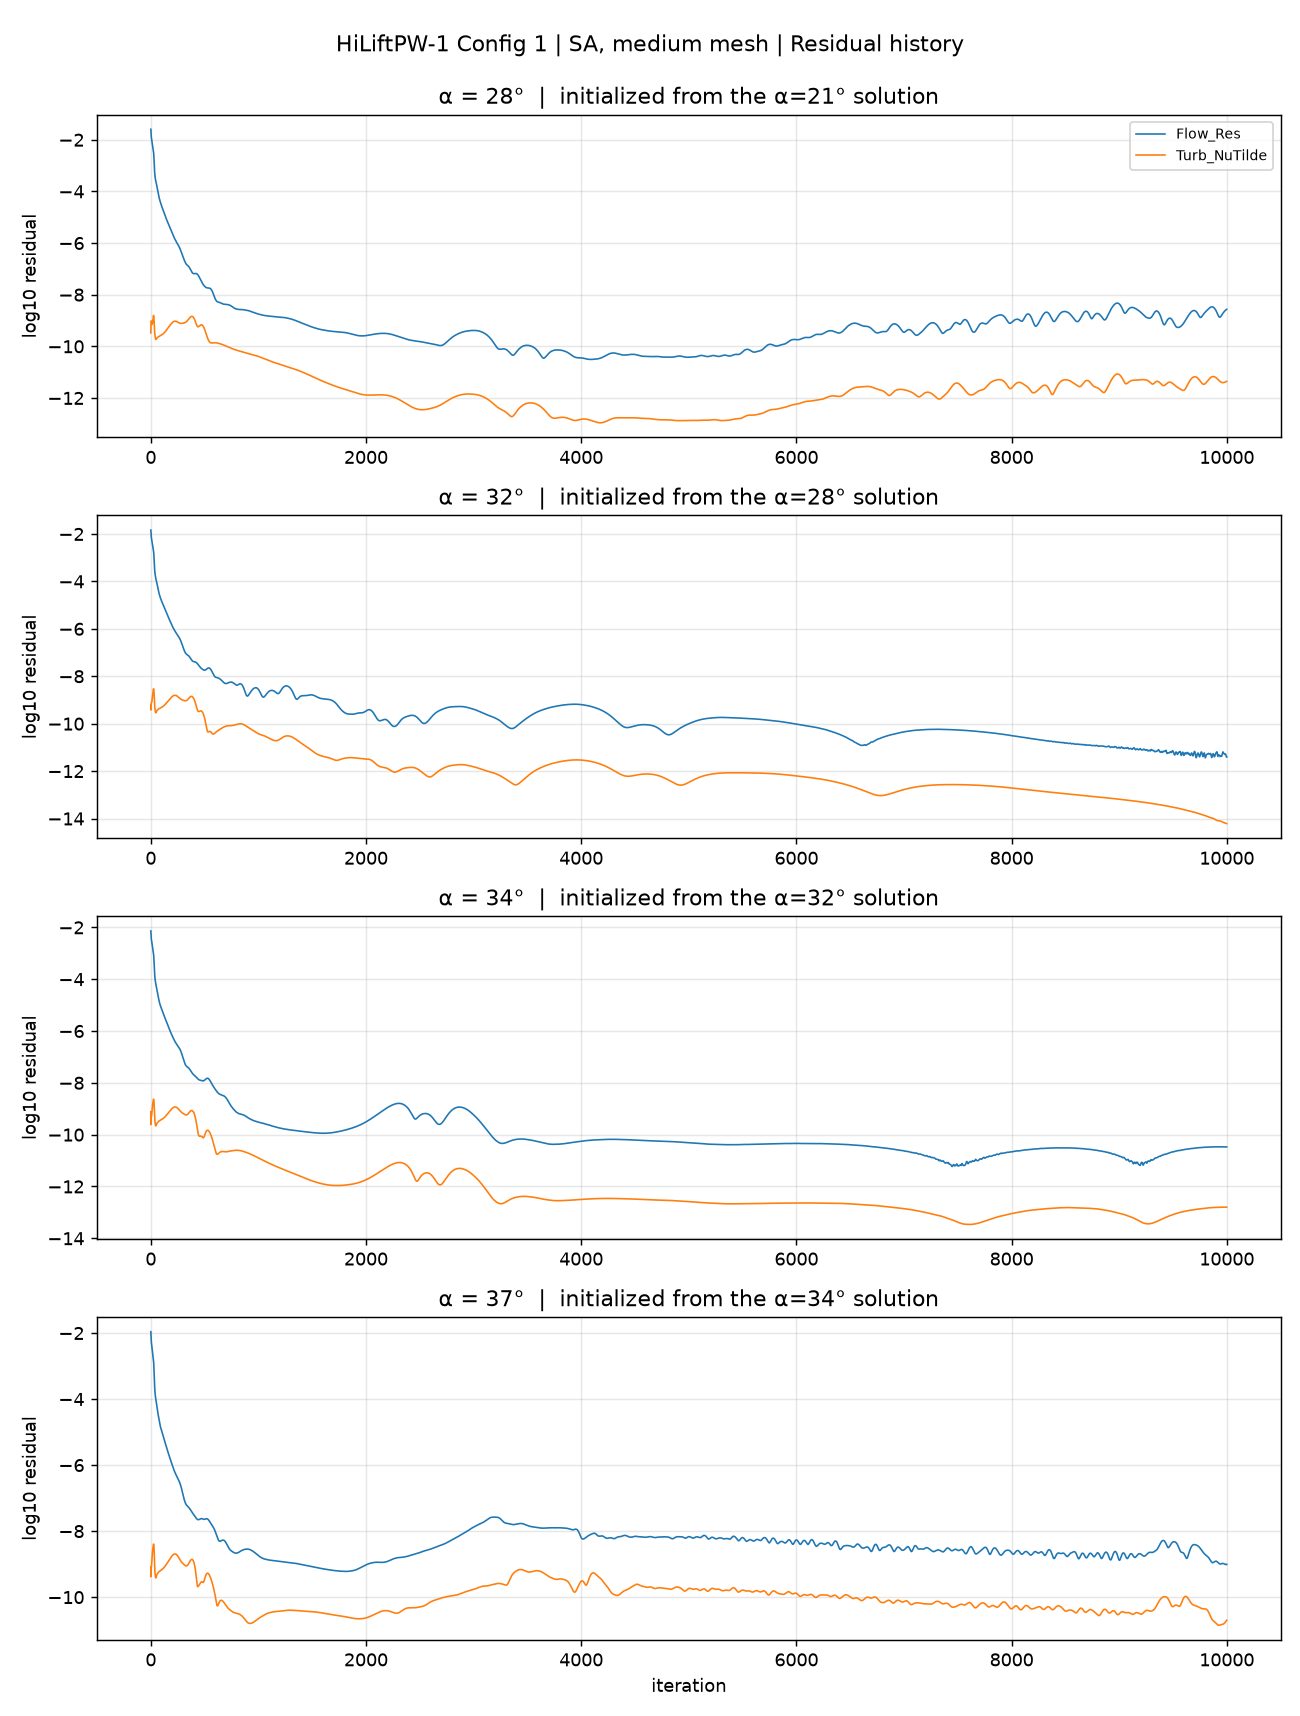
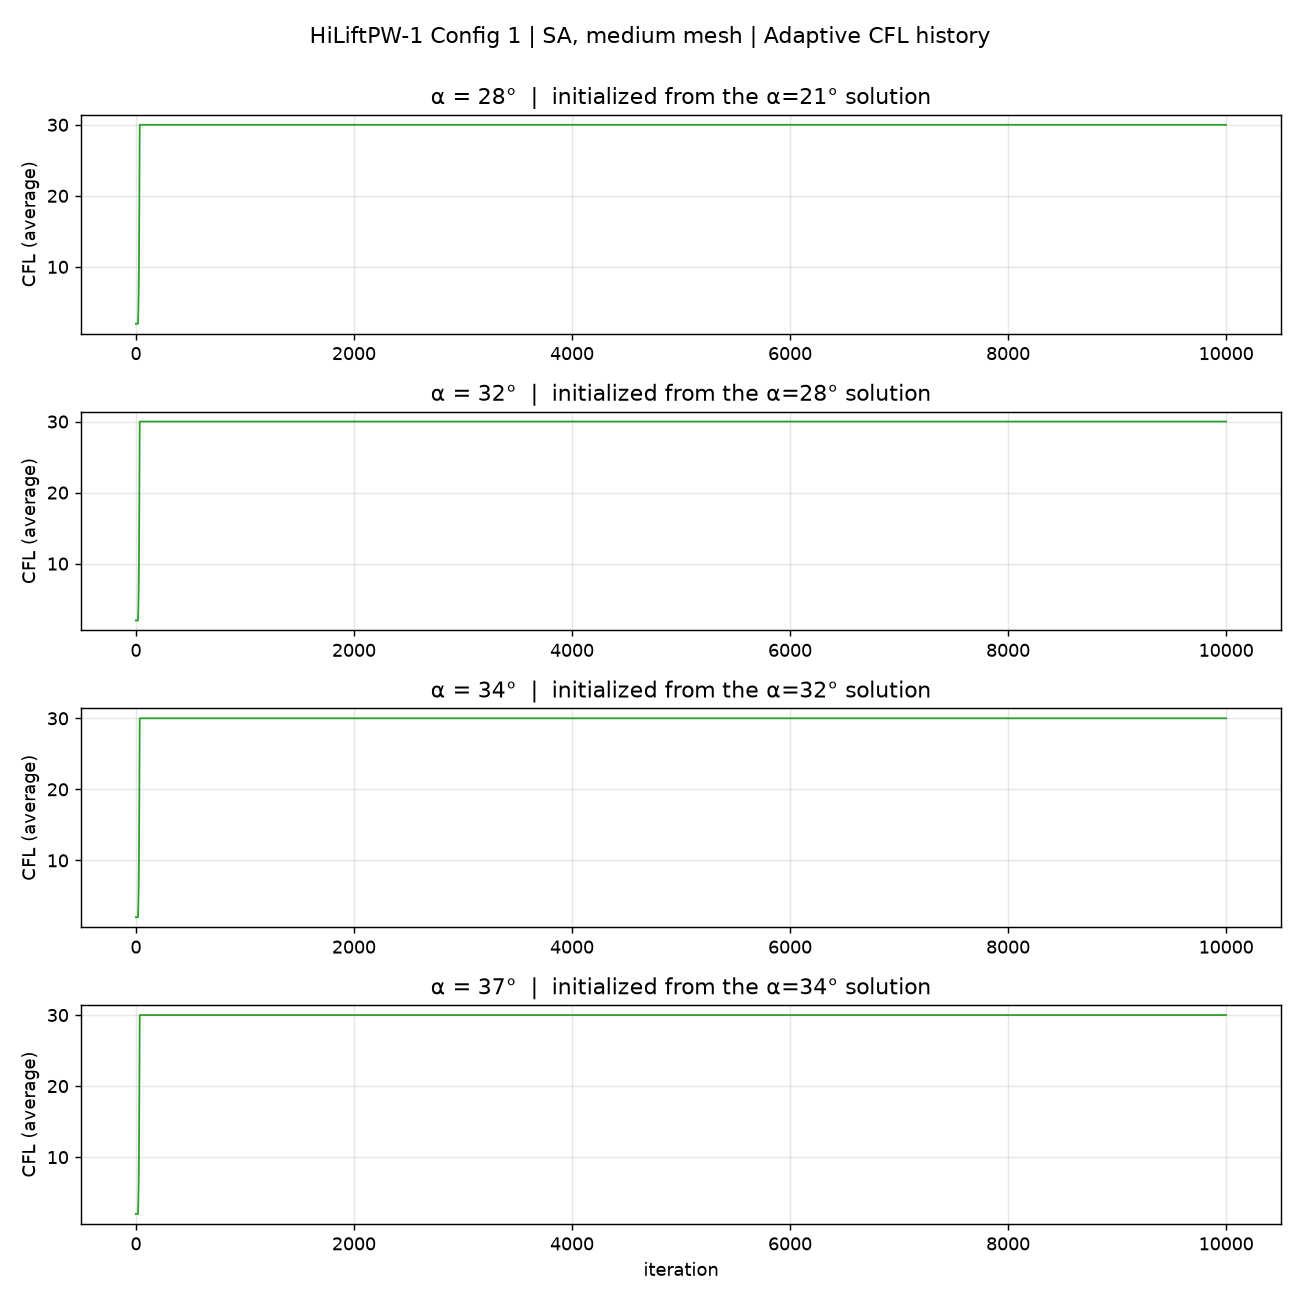
- Spikes in the
α=6°and13°histories mark the points where the run was extended beyond 10,000 iterations; the converged coefficients were not affected. α=28°shows a weak oscillation after iteration 6,500: period about 700 iterations,CLpeak-to-peak 0.0047 (0.16% of the mean). Whether it is physical unsteadiness or an iterative limit cycle was not determined.α=32°and34°show no such oscillation.
24.9 Conclusions and Applicable Scope
- For
α=28–34°— the range around maximum lift — Wake CFD with SA-neg givesCLandCDinside the experimental 95% band, together with surface pressure that matches the experiment at 17–85% span. - The stall is not found in a usable way. At
α=37°the lift starts to fall but does not settle in 10,000 iterations, and the free-stream-started solutions atα≥28°converge to a different, separated state. The results after the stall are not reliable, and no stall angle is claimed. - The solution at
α≥28°depends on the initial field. Results at these angles are valid only for the continued-start procedure described above. - At
α=13°and21°the lift and drag are slightly below the band; with one mesh level this cannot be attributed. - Surface pressure near the wing tip (95% span) is weaker than the experiment; the cause was not investigated.
- Not done: mesh-level (coarse, medium, fine) convergence; Configuration 8; the decreasing-angle (hysteresis) path; a converged
α=37°solution. - These results apply to this mesh, this half-model free-air setting, and
M=0.2. They cannot be extended to other flap/slat settings, higher Reynolds numbers, or tunnel-wall and support effects.
24.10 References
- NASA HiLiftPW-1: 1st AIAA CFD High Lift Prediction Workshop
- Rumsey et al., “Summary of the First AIAA CFD High-Lift Prediction Workshop,” AIAA 2011-939 (also J. Aircraft 48(6), 2011)
- NASA LaRC 14×22 ft Trap Wing experiment, Test 513 (Run 105/106)