6 2D Turbulent Flat-Plate Boundary Layer, M=2 and M=5 — NASA TMR SA Verification
Skin friction versus Re_θ and the law of the wall for the Spalart–Allmaras model on a cooled supersonic/hypersonic flat plate (against van Driest theory and CFL3D)
6.1 Run Provenance and Artifacts
| Item | Value |
|---|---|
| Wake CFD baseline version | 0.23.0 |
| Solver | DBNS |
| Compute device | CPU |
| Parallel execution | 8 MPI ranks |
| Arithmetic precision | Mixed |
| Run date | 2026-10-18 |
Results depend on the solver build that produced them. Read every figure in this report together with the version and date above — re-running the same input on a later build may give different numbers.
All twenty runs (four conditions × five meshes) used the same input apart from the mesh, the freestream and wall-temperature values, and the iteration cap.
6.1.1 Downloadable Files
Not available: standalone input decks and solver result files have not yet been published for download.
6.2 Verification Objective
This case simulates a zero-pressure-gradient turbulent boundary layer on an isothermal flat plate at supersonic and hypersonic Mach numbers with the Spalart–Allmaras (SA) model. It follows the high-Mach flat-plate case of the NASA Turbulence Modeling Resource (TMR), which uses the same mesh family as the low-speed flat-plate case (case 02) but adds compressibility, a real Sutherland viscosity, and a cooled wall. It verifies Wake CFD for:
- the skin-friction coefficient
Cfas a function of the momentum-thickness Reynolds numberRe_θ, against van Driest II theory and the CFL3D SA result published by TMR - the direction and size of the change in
Cfas the mesh is refined, at four Mach number / wall-temperature conditions - the near-wall velocity profile in wall coordinates (
u+versusy+)
The TMR page treats this case as a comparison with theory rather than with other codes, and compares only the fully turbulent region of the plate. This report follows that: the primary quantity is the error in Cf against theory at Re_θ = 10,000, and the CFL3D SA result is shown as a second reference.
6.3 Reference Solution and Data
6.3.1 Analytical Solution
The reference curves are those published by TMR: the skin friction from van Driest II theory (Cf versus Re_θ) and the law of the wall from van Driest I theory (u+ versus y+), each given per condition. TMR states that the theory is applicable to the fully turbulent region only, and compares Cf over 4000 < Re_θ < 13000 and u+ at Re_θ = 10,000.
6.3.2 Numerical Reference
TMR also publishes a CFL3D SA result on the 545×385 mesh for each condition. The CFL3D data cover only Re_θ ≈ 4,000 to 14,000, as distributed. TMR describes such code results as representative rather than definitive, so they are shown for context and the theory is the reference for the error figures. CFL3D and FUN3D use a freestream nu_tilde/nu = 3 for SA; the same value was used here.
6.4 Simulation Conditions
Four conditions were run. The freestream temperature is T∞ = 300 K and the unit Reynolds number is Re = 1.5×10^7 /m for all four.
| Condition (label in figures) | Mach | Tw/T∞ |
Tw |
ρ∞ [kg/m³] |
p∞ [Pa] |
U∞ [m/s] |
|---|---|---|---|---|---|---|
| M=2, Tw/Tinf=1.712 | 2 | 1.712 | 513.6 K | 0.398722 | 34,335.92 | 694.44 |
| M=5, Tw/Tinf=1.090 | 5 | 1.090 | 327.0 K | 0.159489 | 13,734.37 | 1736.09 |
| M=5, Tw/Tinf=2.725 | 5 | 2.725 | 817.5 K | 0.159489 | 13,734.37 | 1736.09 |
| M=5, Tw/Tinf=5.45 | 5 | 5.45 | 1635.0 K | 0.159489 | 13,734.37 | 1736.09 |
| Item | Setting |
|---|---|
| Dimension | 3D (one-cell spanwise extrusion; effectively 2D flow) |
| Geometry | Flat plate, x = [0, 2] m, leading edge at x = 0 |
| Analysis | Steady, compressible DBNS, RANS (Spalart–Allmaras) |
| Gas model | Ideal gas (R = 287.05 J/(kg·K), γ = 1.4), Sutherland viscosity (μ_ref = 1.716×10⁻⁵ Pa·s, T_ref = 273.15 K, S = 110.4 K), constant Prandtl number 0.72 |
| Wall | No-slip, isothermal at Tw above |
For M = 5, the adiabatic wall temperature is about 5.45 T∞, so the three M = 5 conditions have Tw/Taw ≈ 0.2, 0.5, and 1.0. TMR notes that the strongly cooled Tw/T∞ = 1.09 condition is more sensitive to the mesh than the others.
6.5 Mesh
The meshes are the grids distributed by TMR for the flat-plate cases (the same family as case 02), used as distributed, with one cell in the spanwise direction. The y+ values are the wall values reported by the solver at the end of the run.
| Mesh | Streamwise × wall-normal | Node count (including spanwise extrusion) |
|---|---|---|
| Coarsest | 35 × 25 | 1,750 |
| Coarse | 69 × 49 | 6,762 |
| Medium | 137 × 97 | 26,578 |
| Fine | 273 × 193 | 105,378 |
| Finest | 545 × 385 | 419,650 |
First-cell wall y+ (average over the plate):
| Condition | 35×25 | 545×385 |
|---|---|---|
| M=2, Tw/Tinf=1.712 | 2.13 | 0.13 |
| M=5, Tw/Tinf=1.090 | 2.87 | 0.20 |
| M=5, Tw/Tinf=2.725 | 1.02 | 0.06 |
| M=5, Tw/Tinf=5.45 | 0.45 | 0.03 |
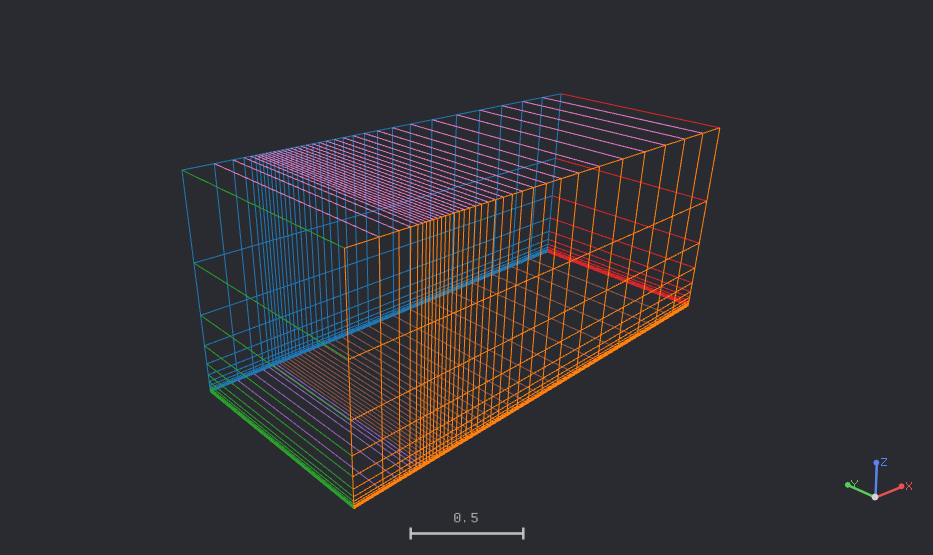
35×25 mesh in three dimensions — one cell in the spanwise direction; the plate is the bottom face, the upstream inlet is on the left, and the colors distinguish boundary groups6.6 Boundary and Initial Conditions
| Boundary | Segment | Type | Setting |
|---|---|---|---|
| Wall | Plate, x∈[0,2] |
wall |
no-slip, isothermal at Tw (see conditions) |
| Symmetry plane | Upstream slip segment + spanwise front/rear faces | symmetry |
— |
| Inlet | Upstream | farfield |
freestream Mach, p∞, T∞, flow in +x, freestream nu_tilde/nu = 3 |
| Outlet | Downstream | pressure_outlet |
supersonic outlet, back pressure p∞ |
| Farfield | Top | farfield |
same as inlet |
Initial field: uniform freestream (Mach, pressure, temperature, flow in +x). The initial turbulence value is the solver default.
6.7 Numerical Methods
| Item | Setting |
|---|---|
| Turbulence model | SA-neg variant with the ft2 term, Pr_t = 0.9 |
| Convective scheme | Roe, second-order reconstruction with no limiter, U-MUSCL kappa = 0, entropy fix off (all solver defaults; the reconstruction gradient is the same Green–Gauss gradient) |
| Gradient method | Green–Gauss |
| Time integration | Euler implicit; FGMRES (error 0.01, at most 15 iterations) with SGS preconditioning for the flow equations (2 sweeps, ω = 0.9) |
| CFL | Constant, 50 on all runs. The three 545×385 M = 5 runs were continued from the iteration-8,000 state with CFL 100 up to iteration 16,000 |
| Convergence criterion | Absolute flow residual −12 (log10), or a 12-order reduction from the initial residual |
| Iteration cap | M = 2: 8,000 (35×25, 69×49), 40,000 (137×97, 273×193), 60,000 (545×385); M = 5: 8,000 on all meshes, 16,000 for the 545×385 runs as described above |
| Wall treatment | Solver default (automatic); no alternative was compared |
Assumptions and differences from the references.
- The TMR reference is the standard SA model; the SA-neg variant used here is the same where
nu_tildeis non-negative. The effect of the variant was not isolated. - CFL3D and FUN3D advect the turbulence variable with first-order upwinding, as stated by TMR. Wake CFD advects the turbulence variable with a first-order scheme in the build used (
0.21.5), so this matches. - The CFL value was chosen to make the runs converge in a practical number of iterations; at
CFL 5theM = 5runs stalled on the fine meshes. Converged solutions did not depend on the CFL value in a check on the137×97mesh (CFL 20 and 50 gave the sameCfatRe_θ = 10,000).
6.8 Results
6.8.1 Convergence History
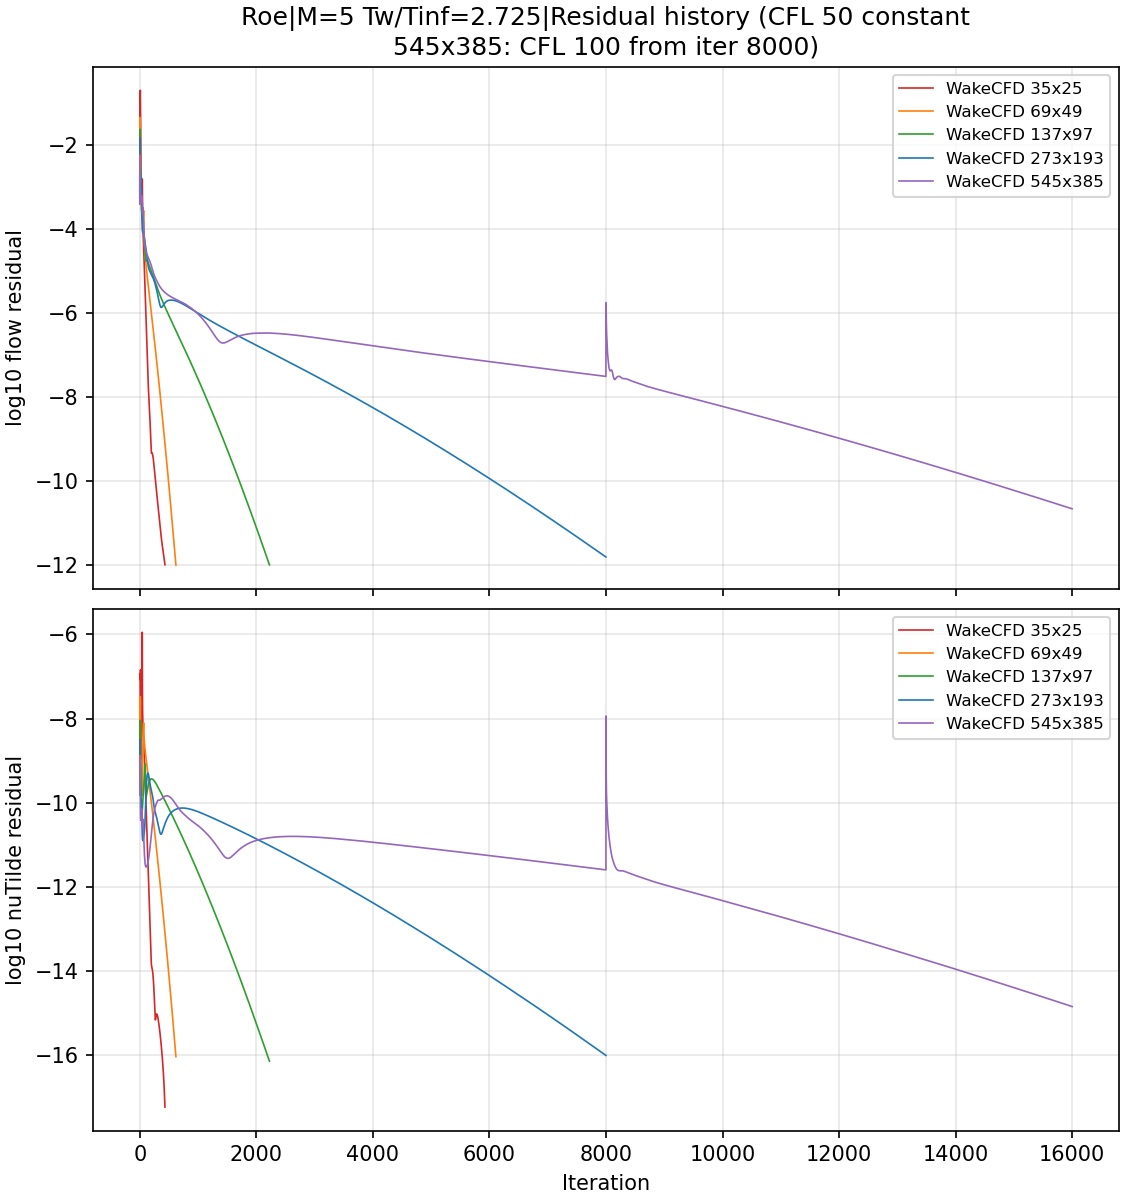
Iterations to termination, and the final absolute flow residual (log10) for the runs that ended on the iteration cap:
| Condition | 35×25 | 69×49 | 137×97 | 273×193 | 545×385 |
|---|---|---|---|---|---|
| M=2, Tw/Tinf=1.712 | 718 | 718 | 2,214 | 8,008 | 28,530 |
| M=5, Tw/Tinf=1.090 | 418 | 718 | 2,619 | 8,000 (−10.59) | 16,000 (−9.72) |
| M=5, Tw/Tinf=2.725 | 432 | 620 | 2,225 | 8,000 (−11.82) | 16,000 (−10.67) |
| M=5, Tw/Tinf=5.45 | 626 | 619 | 1,917 | 6,357 | 16,000 (−11.69) |
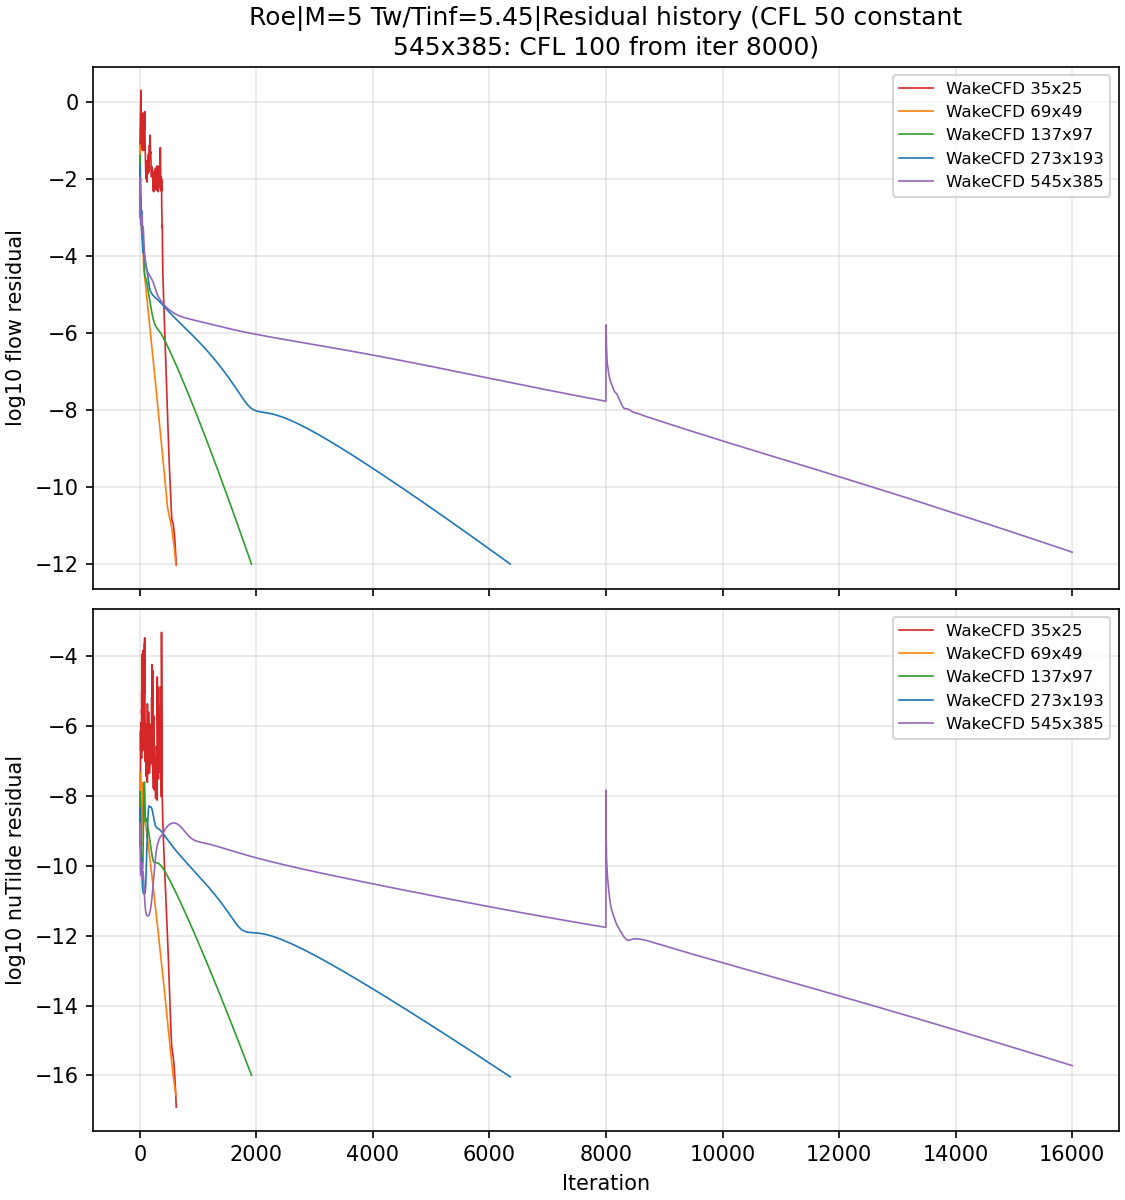
Fifteen of the twenty runs reached the residual criterion of −12. Five ended on the iteration cap with a residual between −9.7 and −11.8, still decreasing: the 273×193 runs of M=5, Tw/Tinf=1.090 and 2.725, and the three 545×385 M = 5 runs. The criterion was not met in these five, and they are treated as converged for this comparison: on 545×385 the Cf at Re_θ = 10,000 differs from the 273×193 value by 0.6 percentage points of the theory value or less (table below), so the mesh trend is not changed by these runs ending short of the criterion, as far as this comparison shows. A longer run was not made to confirm that the Cf values no longer change.
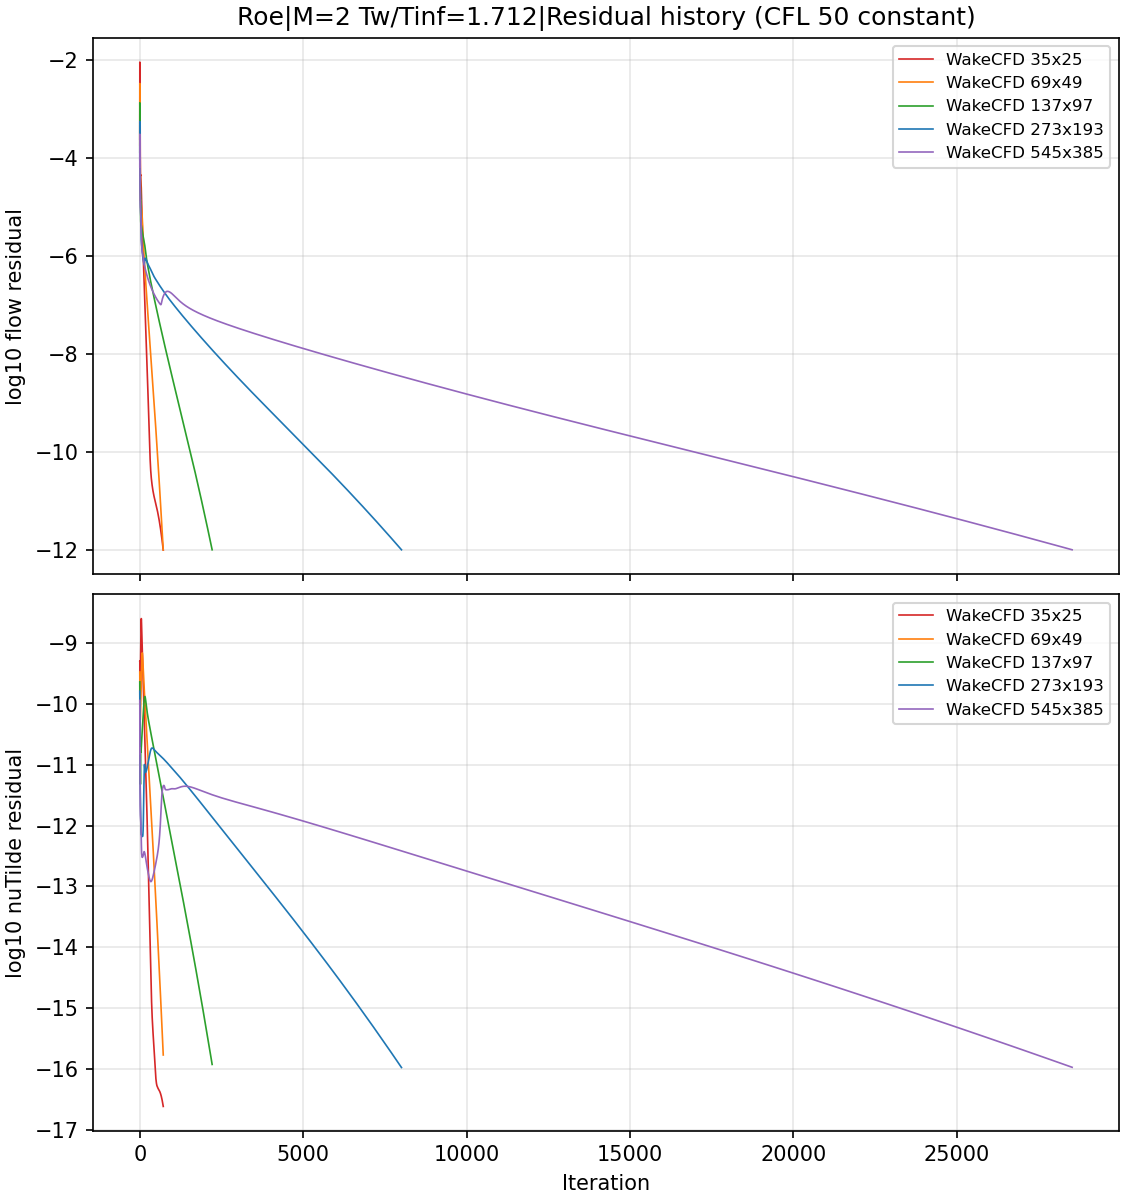
nu_tilde residuals on the five meshes — M=2, Tw/Tinf=1.712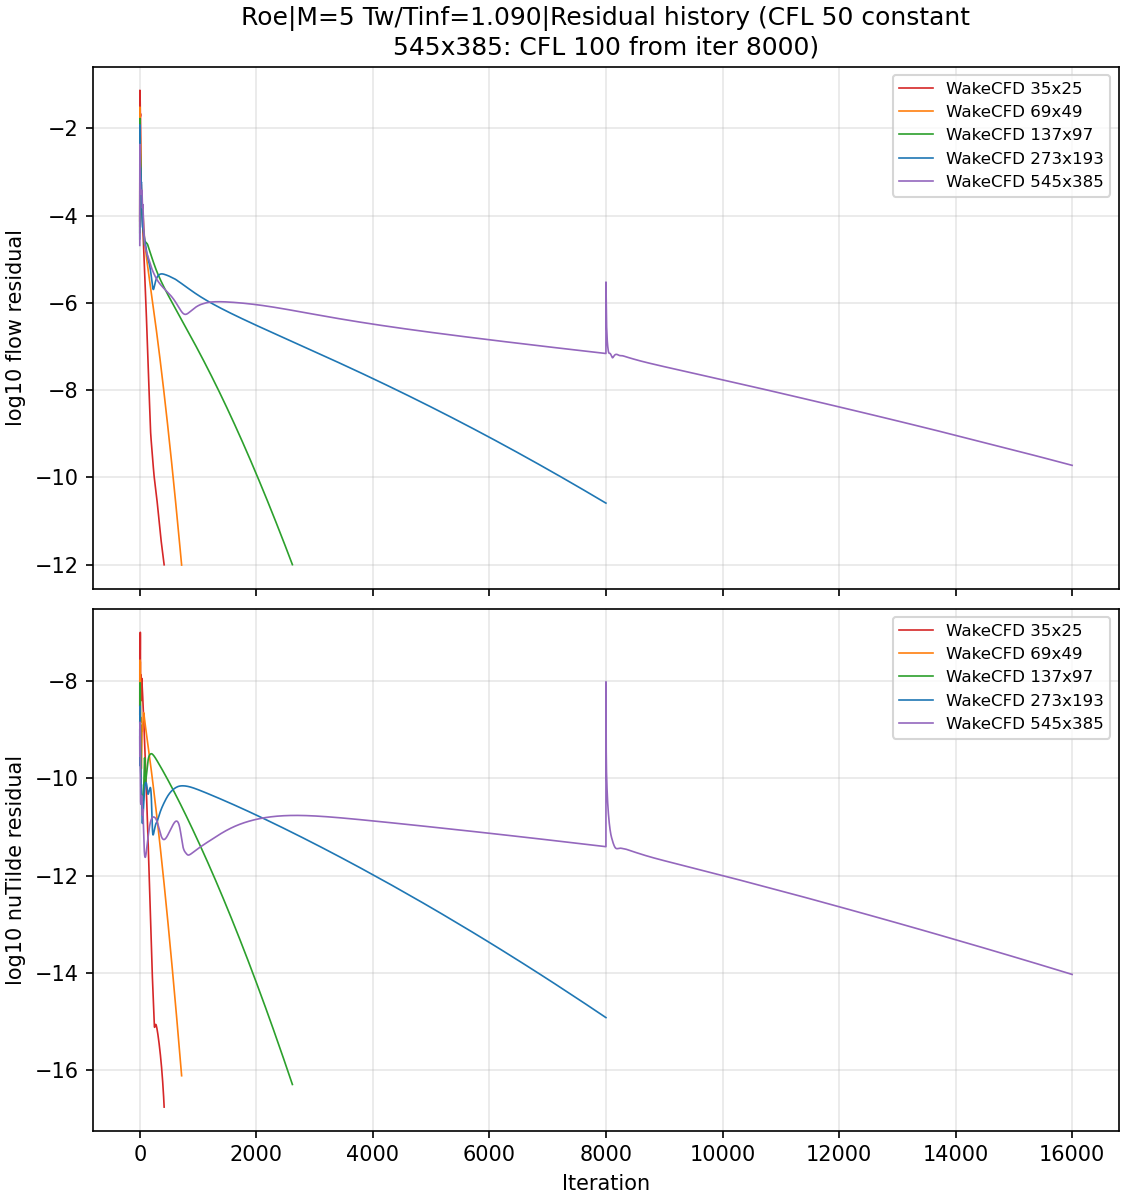
6.8.2 Skin Friction
Cf was taken from the wall shear stress, and Re_θ from the momentum thickness computed from the density and velocity profile at each streamwise station, integrated up to the first point where u/U∞ ≥ 0.99. The figures show Cf over Re_θ ≥ 1,000; closer to the leading edge Cf rises steeply near the first points and Re_θ is not monotonic in x, so that region is not plotted. All errors below are at Re_θ = 10,000.
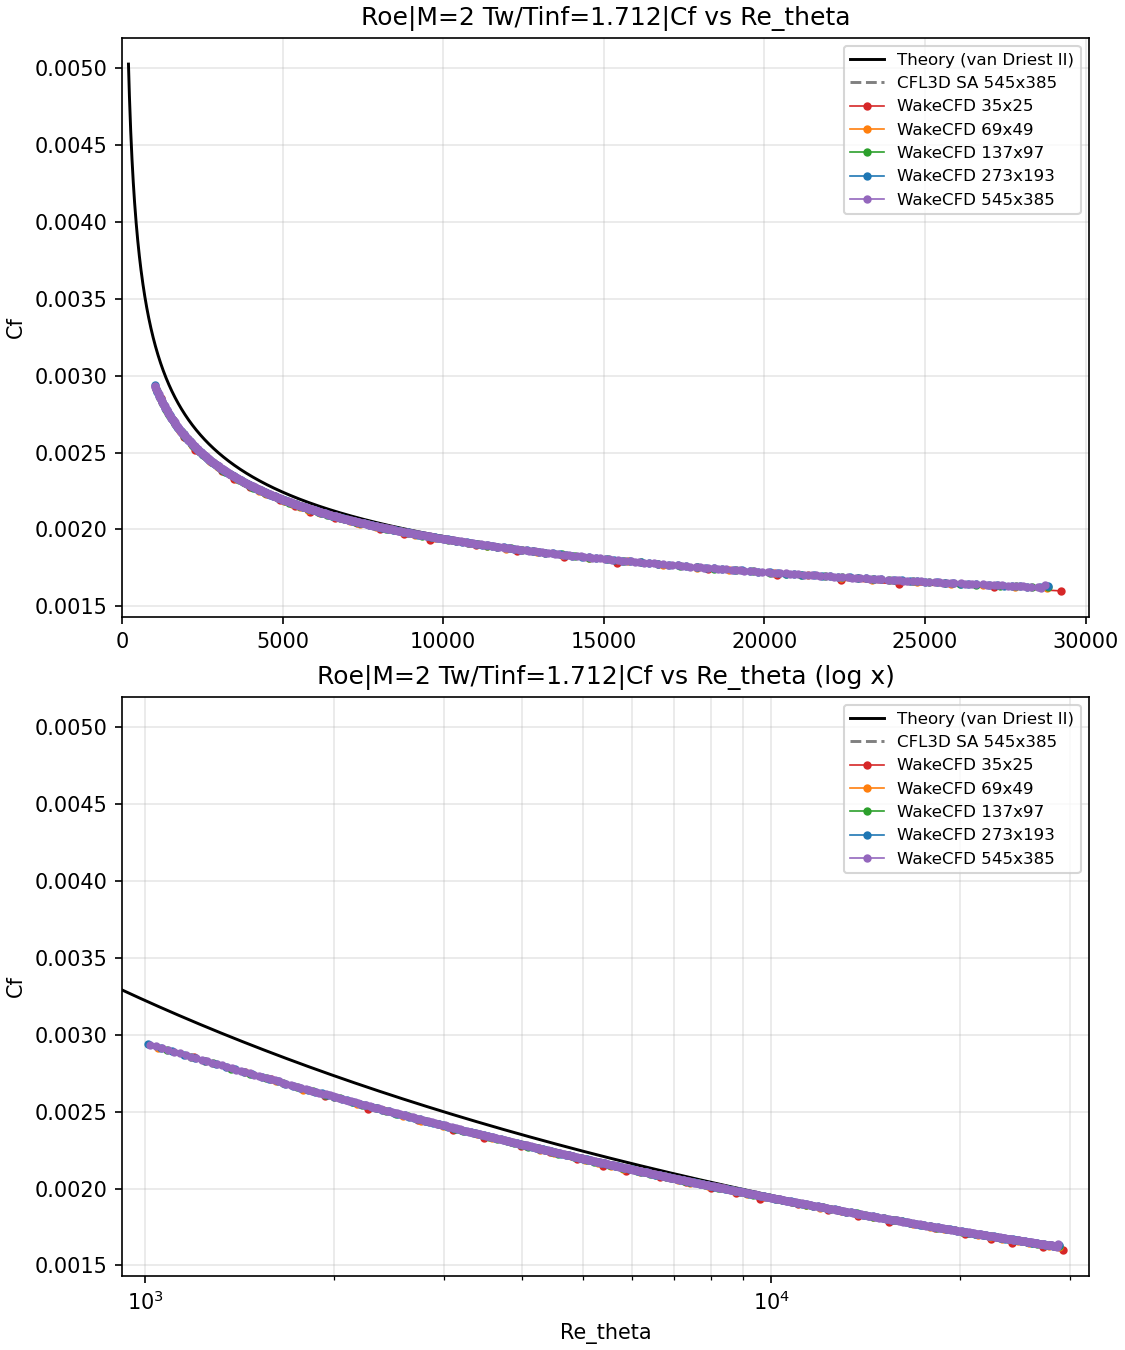
Cf versus Re_θ — M=2, Tw/Tinf=1.712, five meshes, linear (top) and logarithmic (bottom) Re_θ axis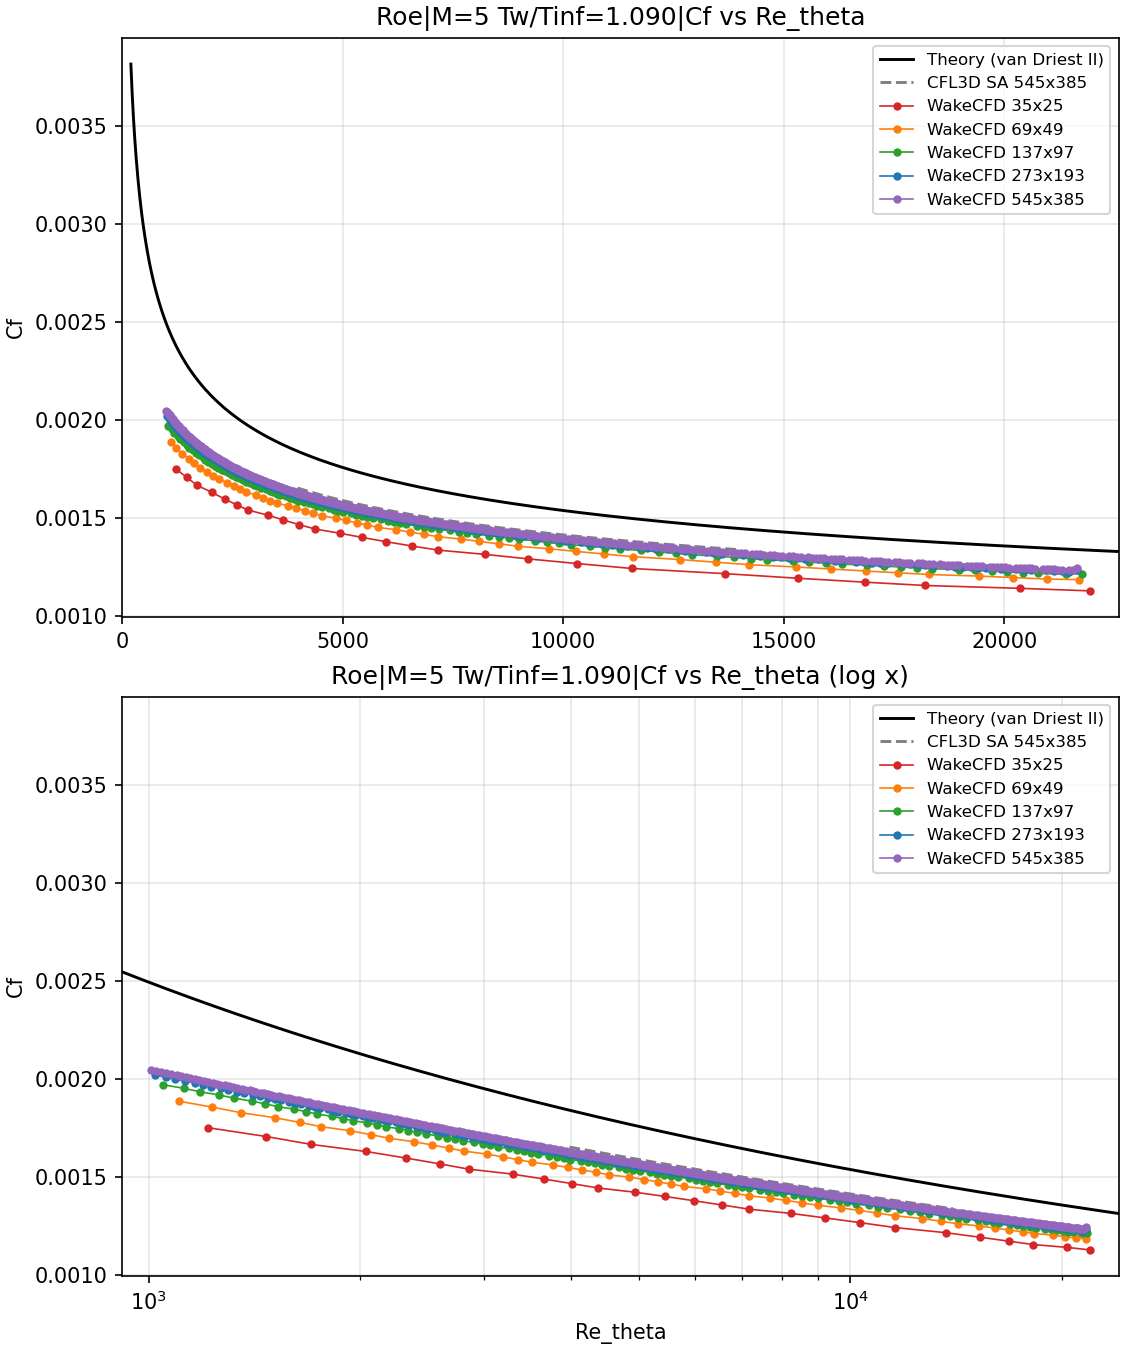
Cf versus Re_θ — M=5, Tw/Tinf=1.090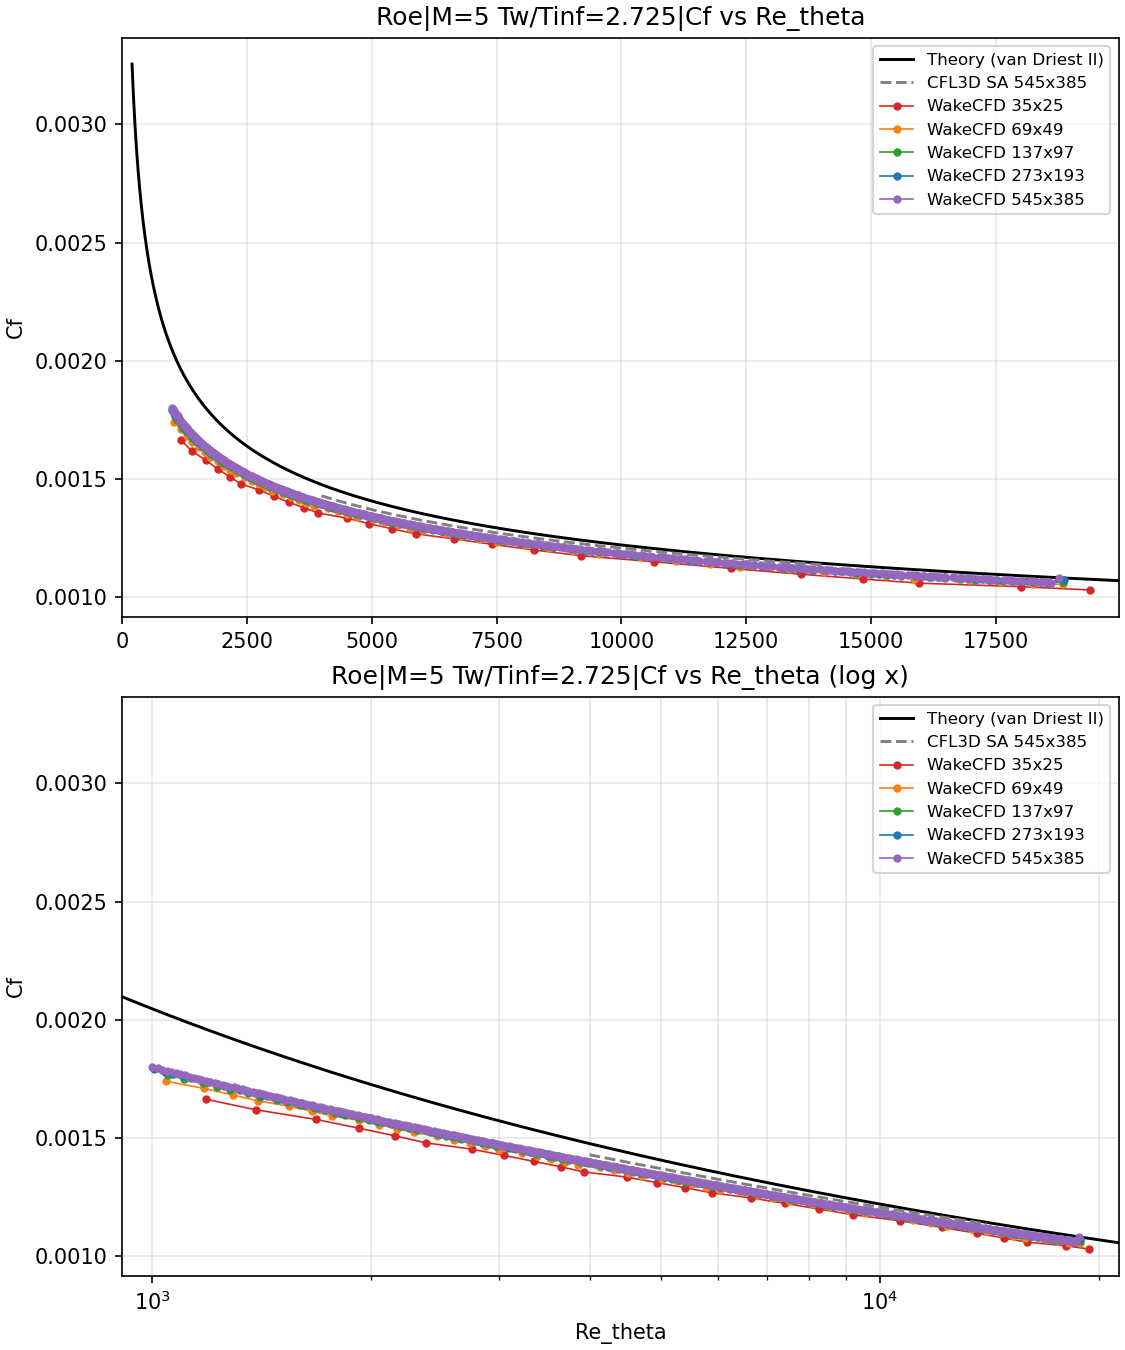
Cf versus Re_θ — M=5, Tw/Tinf=2.725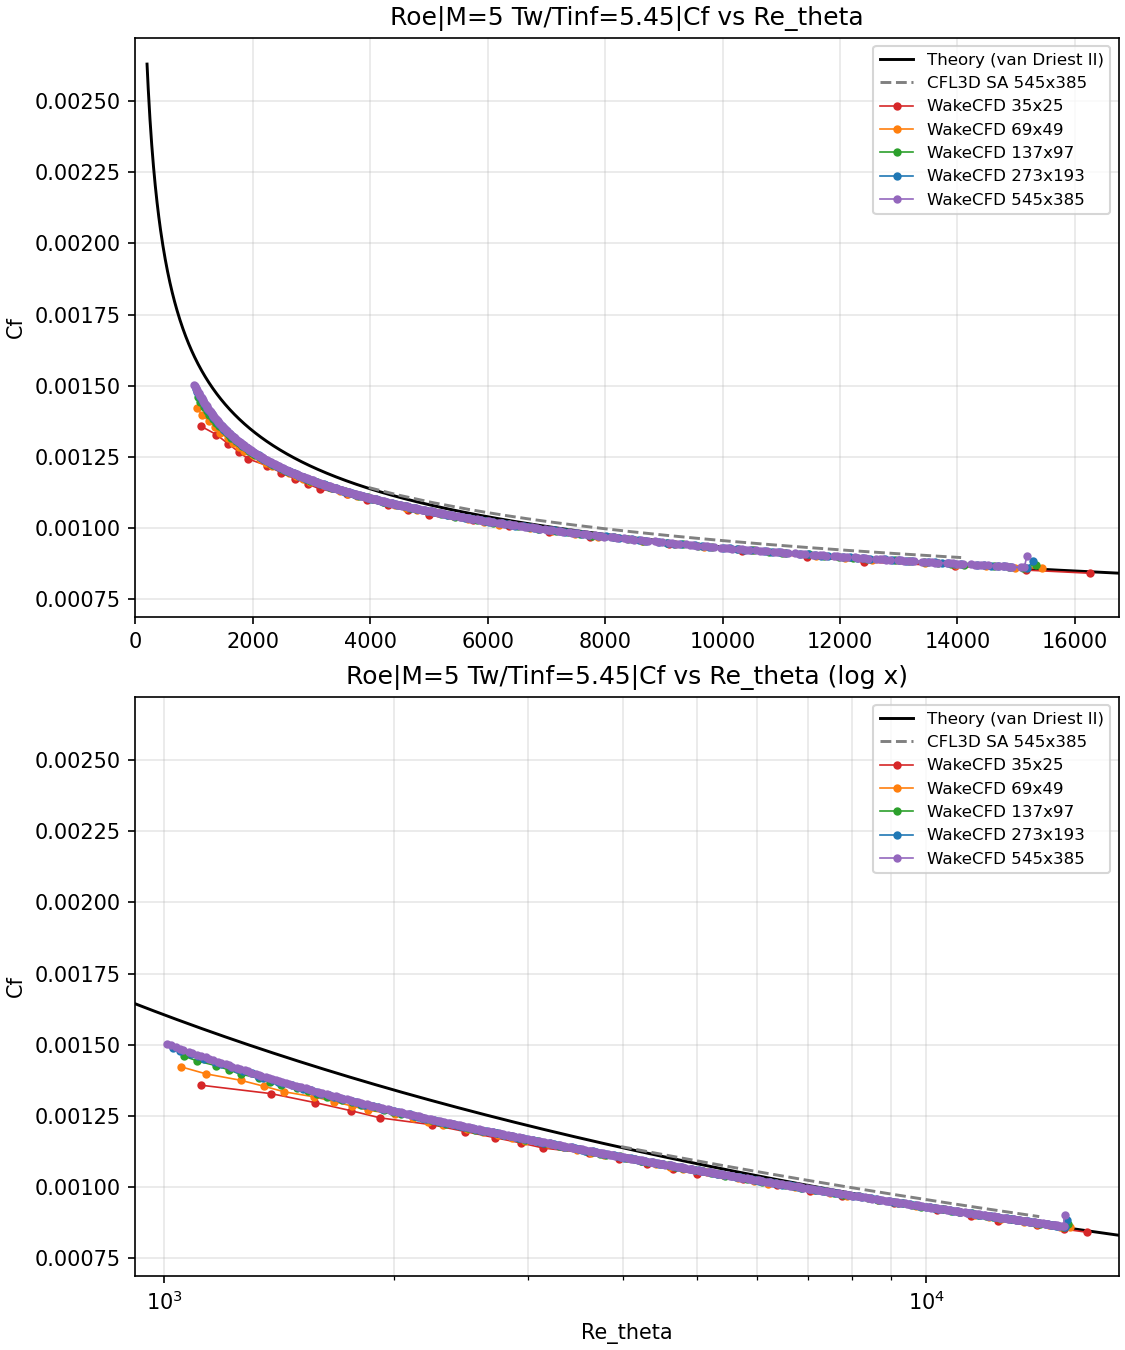
Cf versus Re_θ — M=5, Tw/Tinf=5.45Difference of Wake CFD Cf relative to van Driest II theory at Re_θ = 10,000:
| Condition | 35×25 | 69×49 | 137×97 | 273×193 | 545×385 |
|---|---|---|---|---|---|
| M=2, Tw/Tinf=1.712 | −1.60% | −0.85% | −0.81% | −0.73% | −0.72% |
| M=5, Tw/Tinf=1.090 | −17.14% | −13.13% | −11.05% | −9.87% | −9.28% |
| M=5, Tw/Tinf=2.725 | −4.88% | −3.71% | −3.14% | −3.01% | −2.97% |
| M=5, Tw/Tinf=5.45 | −0.73% | −0.54% | −0.38% | −0.17% | −0.22% |
Difference of Wake CFD Cf relative to the CFL3D SA result at Re_θ = 10,000 (CFL3D is on the 545×385 mesh only):
| Condition | CFL3D vs. theory | 35×25 | 69×49 | 137×97 | 273×193 | 545×385 |
|---|---|---|---|---|---|---|
| M=2, Tw/Tinf=1.712 | −0.15% | −1.49% | −0.74% | −0.69% | −0.62% | −0.61% |
| M=5, Tw/Tinf=1.090 | −8.08% | −9.86% | −5.50% | −3.23% | −1.94% | −1.30% |
| M=5, Tw/Tinf=2.725 | −1.08% | −3.84% | −2.65% | −2.08% | −1.95% | −1.91% |
| M=5, Tw/Tinf=5.45 | +2.44% | −3.09% | −2.91% | −2.75% | −2.55% | −2.60% |
M = 2andM = 5, Tw/T∞ = 5.45(the warmest wall): the error against theory falls with the mesh and ends within 0.8% of theory on the three finest meshes forM = 2and within 0.4% forTw/T∞ = 5.45. On the finest mesh Wake CFD is 0.22% (Tw/T∞ = 5.45) and 0.72% (M = 2) below theory.M = 5, Tw/T∞ = 2.725: the error against theory goes from −4.88% to −2.97%, changing little over the last two refinements (−3.01% to −2.97%).M = 5, Tw/T∞ = 1.090(the most strongly cooled wall): the error against theory remains large, −9.28% on the finest mesh, and is still moving with the mesh (−11.05%, −9.87%, −9.28% over the last three meshes). CFL3D SA is also 8.08% below theory at thisRe_θ, and Wake CFD on the finest mesh is within 1.30% of CFL3D. For this condition the difference from theory therefore appears to be a property of the SA model rather than a discretization error of this run, but that attribution was not tested (for example with another turbulence model).- Offset from CFL3D at the warmer
M = 5walls. ForTw/T∞ = 2.725and5.45Wake CFD stays about 1.9% and 2.6% below CFL3D on the two finest meshes, with almost no change from273×193to545×385, so it does not decrease with refinement. It was not isolated whether this comes from differences in setting (for example the viscosity law or theRe_θextraction) or from the models. The theory comparison is the primary result for this case, and Wake CFD is close to theory for these two conditions (−2.97% and −0.22%).
6.8.3 Law of the Wall
u+ = u/u_τ with u_τ = sqrt(τ_w/ρ_w) is plotted against y+ at the station nearest Re_θ = 10,000 on each mesh, together with the van Driest I curve and the CFL3D SA result from TMR. Compared visually, the curves of the three finest meshes lie on top of each other and on the CFL3D curve; the coarser meshes sit above them in the log region and the outer plateau. The theory curve lies below the computed profiles in the buffer and log regions; the gap is largest for Tw/T∞ = 1.09, where the Cf error against theory is also largest. Only the Cf values above were quantified.
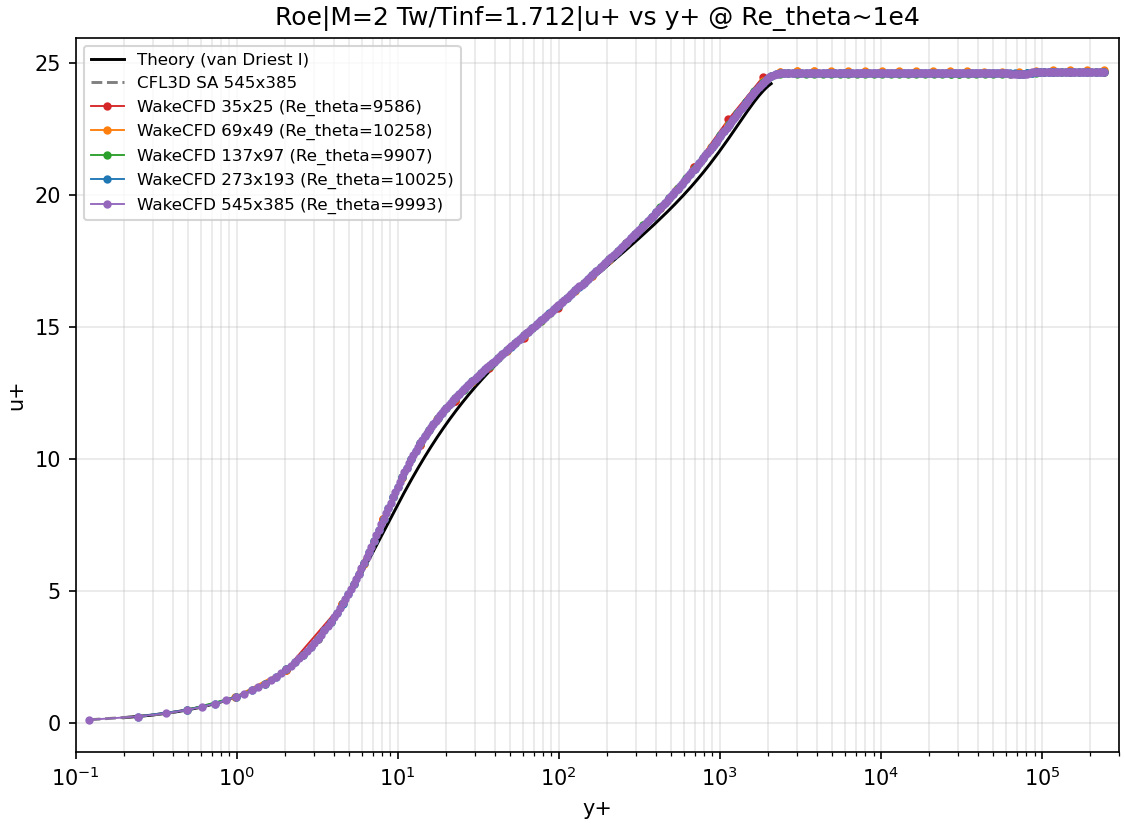
u+ versus y+ at Re_θ ≈ 10,000 — M=2, Tw/Tinf=1.712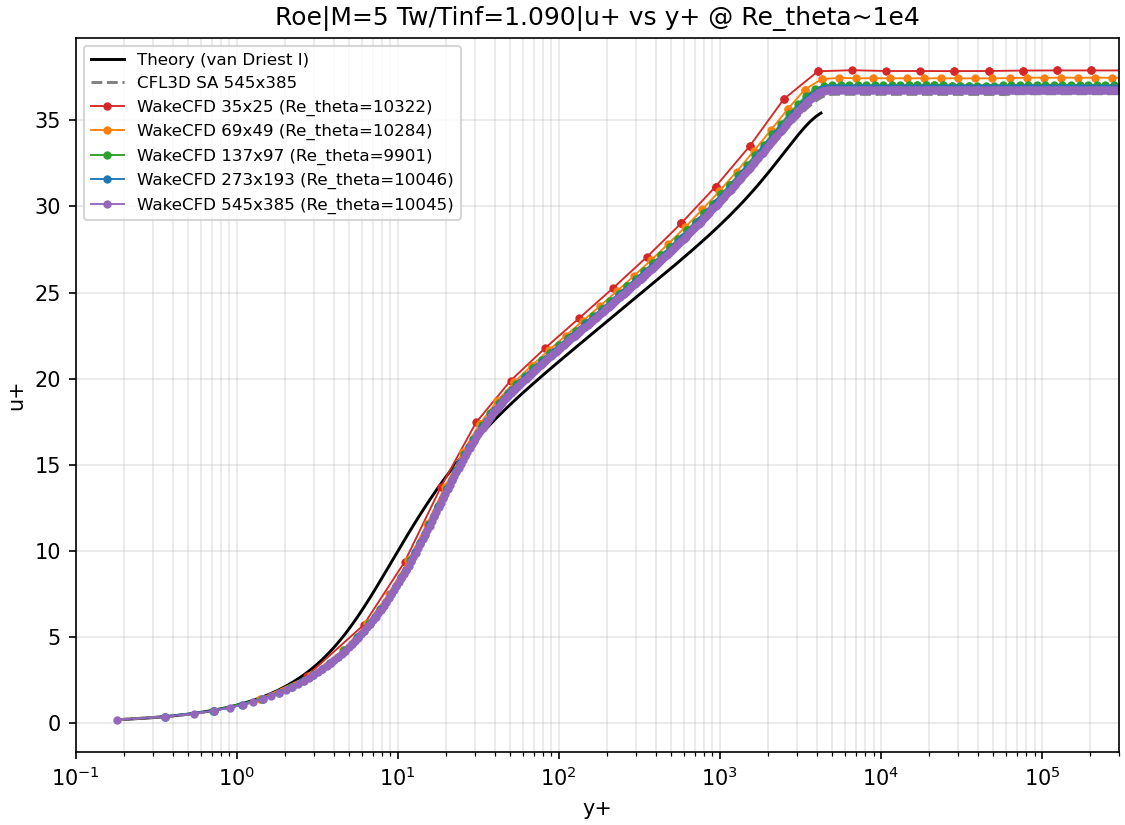
u+ versus y+ — M=5, Tw/Tinf=1.090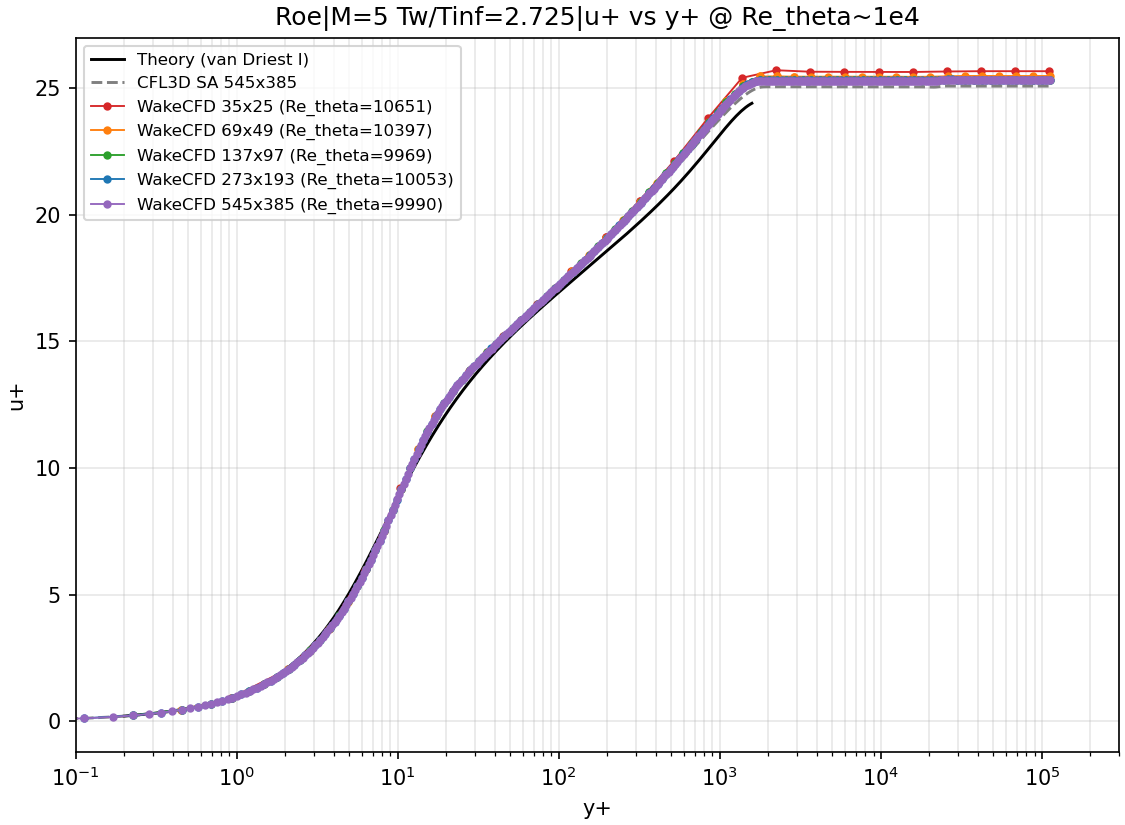
u+ versus y+ — M=5, Tw/Tinf=2.725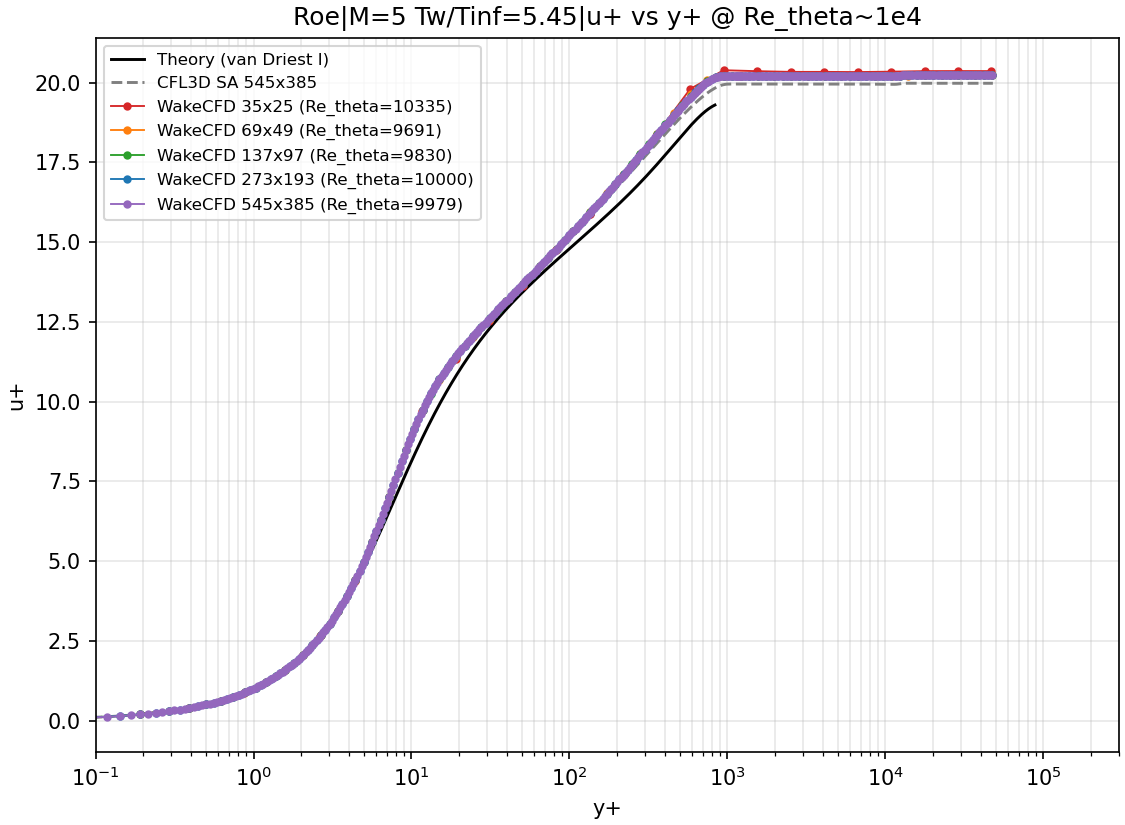
u+ versus y+ — M=5, Tw/Tinf=5.456.9 Conclusions and Applicable Scope
- On the finest mesh, Wake CFD’s SA result agrees with van Driest II theory at
Re_θ = 10,000within 0.72% (M=2, Tw/T∞=1.712), 0.22% (M=5, Tw/T∞=5.45) and 2.97% (M=5, Tw/T∞=2.725). For the strongly cooledM=5, Tw/T∞=1.09wall it is 9.28% below theory, where the CFL3D SA result published by TMR is also 8.08% below theory and Wake CFD is within 1.30% of CFL3D. - Refining the mesh moves
Cftoward its finest-mesh value in all four conditions, with one small exception: forTw/T∞ = 5.45the last step goes from −0.17% to −0.22% against theory. ForTw/T∞ = 1.09the change from273×193to545×385is still 0.6 percentage points, so grid independence is not established for that condition. - Fifteen of the twenty runs met the residual criterion. Five (the two
273×193and three545×385M = 5runs listed above) ended on the iteration cap at residuals between−9.7and−11.8and are treated as converged for the comparison; they were not run longer to confirm theCfvalues no longer change. - Against CFL3D, Wake CFD shows a difference of about 2% to 3% on the finest mesh at the two warmer
M = 5walls that does not decrease with refinement; its cause was not identified. - These results apply to a zero-pressure-gradient, isothermal flat plate at
M = 2andM = 5with the SA model, over the fully turbulent rangeRe_θ ≈ 4,000to13,000. They cannot be generalized to pressure gradients, shock–boundary-layer interaction, transition, or other turbulence models. The effect of the wall treatment option and the leading-edge region were not examined.