27 3D Supersonic Square Duct — SA-QCR2000 Secondary-Flow Validation
Confirmation that the Quadratic Constitutive Relation reproduces corner secondary flow, against the Davis-Gessner (1989) experiment and CFL3D/FUN3D reference solutions
27.1 Run Provenance and Artifacts
| Item | Value |
|---|---|
| Wake CFD baseline version | 0.22.0 |
| Solver | DBNS |
| Compute device | GPU (NVIDIA RTX A6000) |
| Parallel execution | 1 MPI rank |
| Arithmetic precision | FP64 |
| Run date | 2026-09-09 |
Results depend on the solver build that produced them. Read every figure in this report together with the version and date above — re-running the same input on a later build may give different numbers.
27.1.1 Downloadable Files
Not available: standalone input decks and solver result files have not yet been published for download.
27.2 Validation Objective
This case checks whether Wake CFD’s implementation of the Spalart Quadratic Constitutive Relation (QCR2000, models.turbulence.sa.qcr2000) reproduces corner secondary flow of the second kind in a supersonic square duct. A linear Boussinesq turbulence model (SA alone) cannot generate this secondary flow by construction, so an SA-versus-SA+QCR2000 comparison gives an unambiguous physical pass/fail signal. Results are compared against the NASA Turbulence Modeling Resource (TMR) 3D Supersonic Square Duct case, which provides the Davis and Gessner (1989) experimental data together with CFL3D (SA) and FUN3D (SA-QCR2000) reference solutions on the same grid.
27.3 Reference Solution and Data
| Item | Setting |
|---|---|
| References | Davis and Gessner (1989) experiment; CFL3D (SA) and FUN3D (SA-QCR2000), published by NASA TMR |
27.4 Simulation Conditions
| Item | Setting |
|---|---|
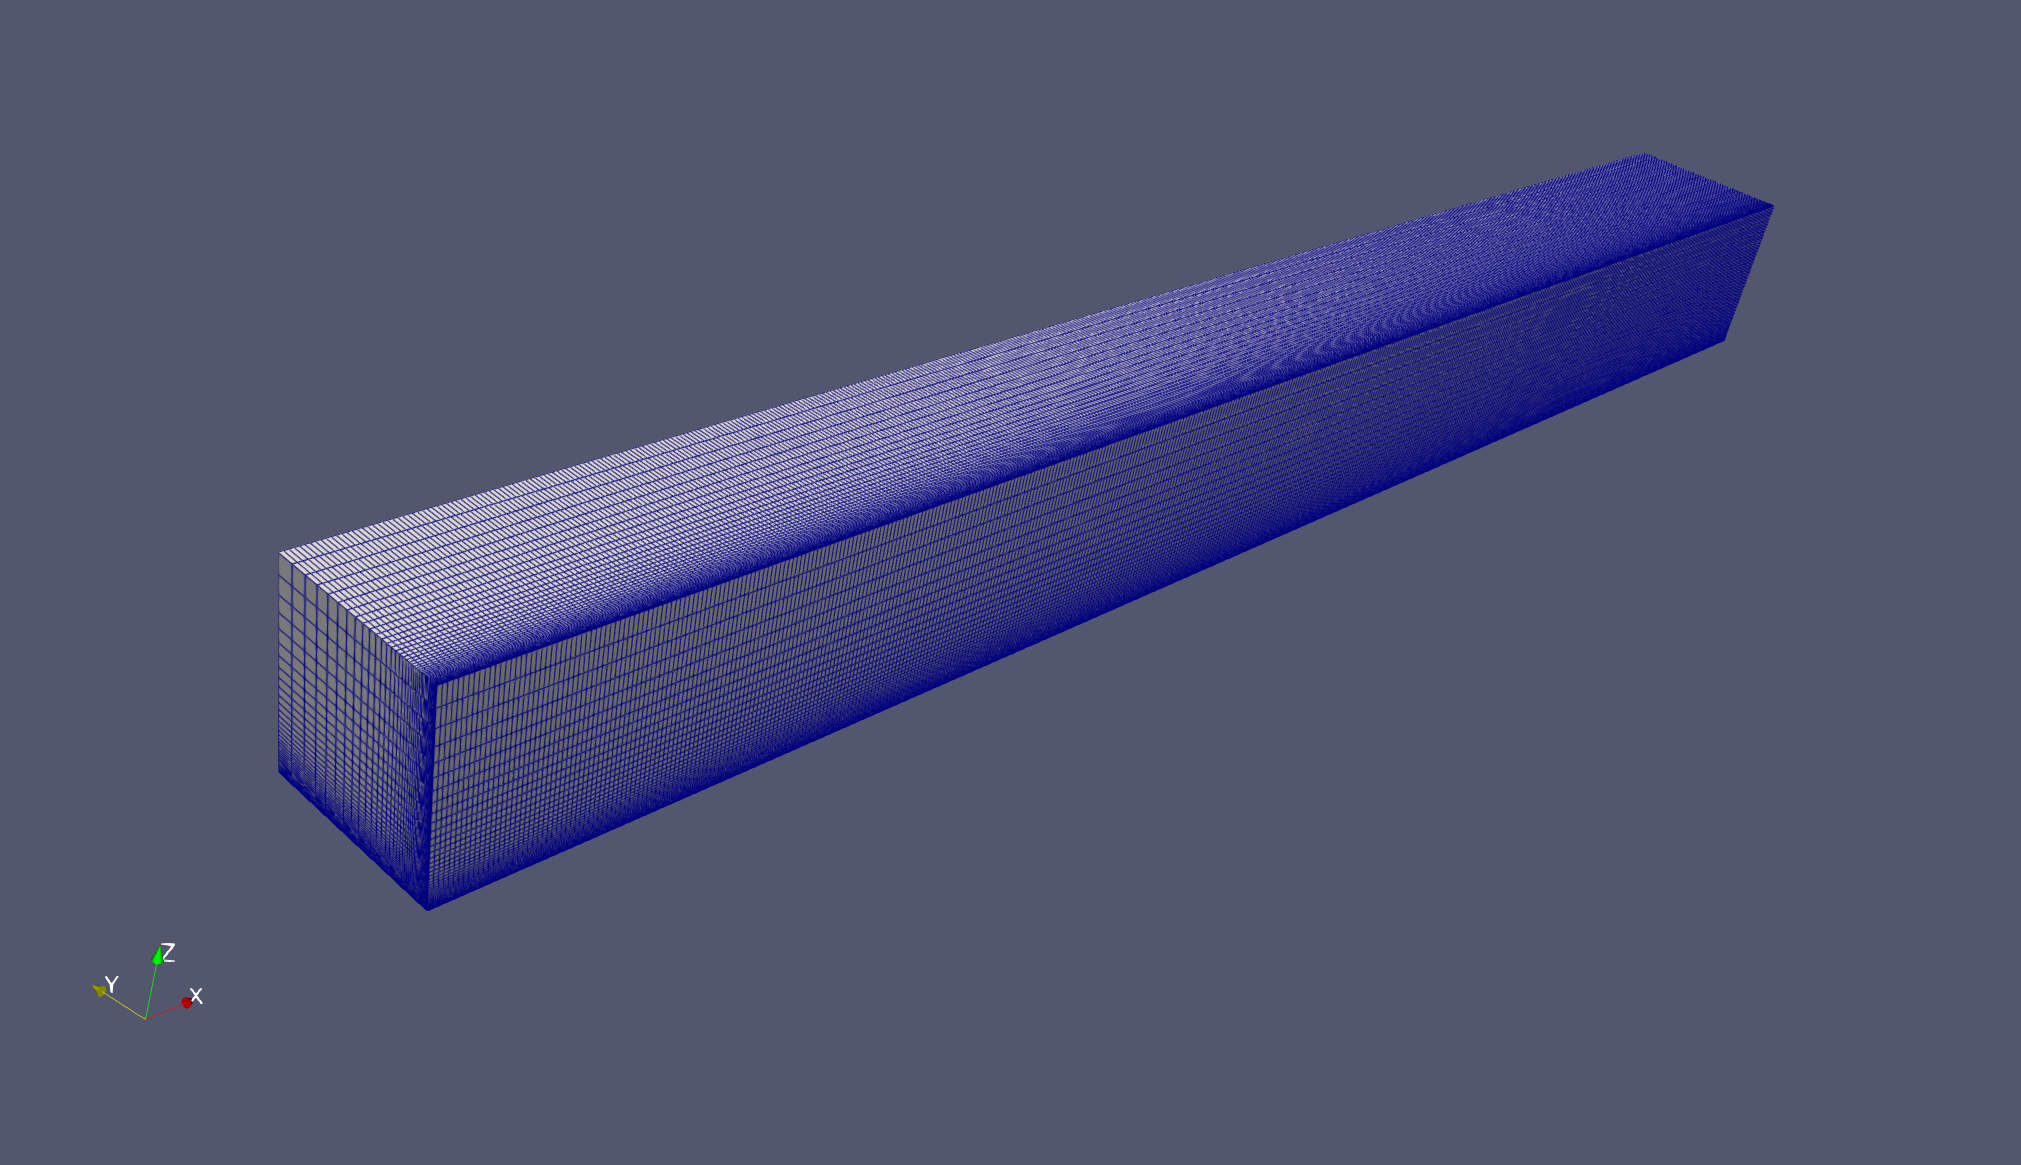
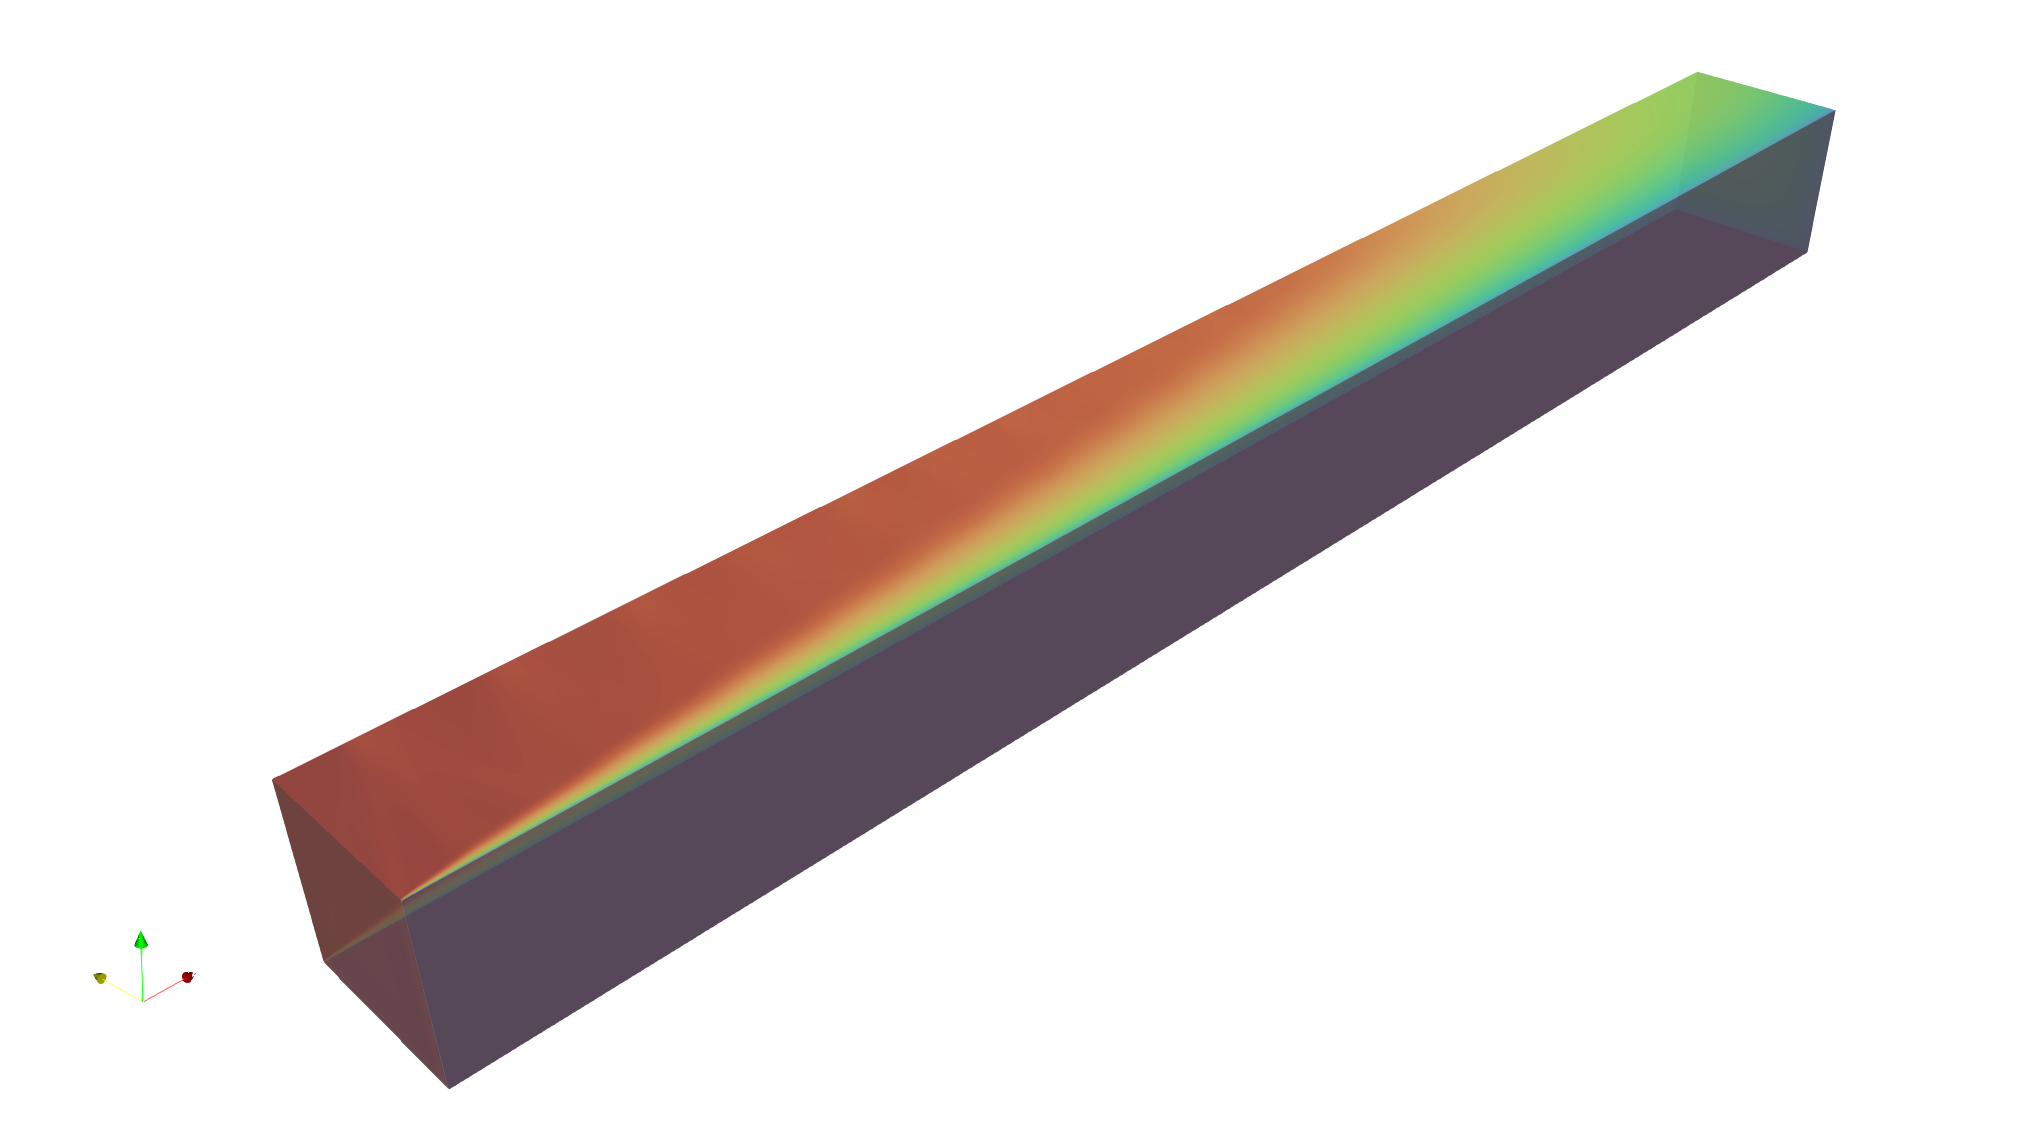
| Geometry | Square duct, D = 25.4 mm, domain length 52D; one-quarter model with two symmetry planes and two viscous walls |
| Analysis | Steady, compressible DBNS, RANS (SA, run with and without QCR2000) |
| Inflow Mach | 3.9 (uniform inflow; boundary layer develops from the duct entrance) |
Re_D |
0.508×10⁶ |
| Freestream temperature | 288.889 K |
| Viscosity law | Sutherland |
| Judgment stations | x/D = 40, 50 (fully turbulent region only, per the case’s own transition-delay caveat for M>2) |
The reference solutions are computed on the medium grid, so the comparison grid is fixed at medium to keep the code-to-code comparison free of a grid-resolution variable. A coarse-grid run confirms that the SA result is already grid-converged at coarse resolution; the QCR2000 secondary-flow intensity still shows a modest coarse-to-medium change (see Applicable Scope).
27.5 Mesh
| Item | Setting |
|---|---|
| Mesh | Unstructured hexahedral, nested two-level family used for comparison: coarse (241×41×41) and medium (481×81×81, matching the reference solutions’ grid) |
27.6 Boundary and Initial Conditions
| Item | Setting |
|---|---|
| Wall | Adiabatic, no-slip |
Initial field: Not reported.
27.7 Numerical Methods
| Item | Setting |
|---|---|
| Convective scheme | Roe, Green–Gauss gradients, Venkatakrishnan limiter (K=0.05, frozen after initial transient) |
| Time integration | Euler implicit, CFL schedule 0.5 → 5.0 |
27.8 Results
27.8.1 Secondary-Flow Signature (SA vs. SA-QCR2000)
In-plane velocity magnitude (relative to centerline axial velocity u_max) at the judgment stations, medium grid:
| Model | max \|(v,w)\|/u_max |
rms |
|---|---|---|
| SA | 0.09–0.14% | 0.02–0.03% |
| SA-QCR2000 | 1.18–1.19% | 0.53% |
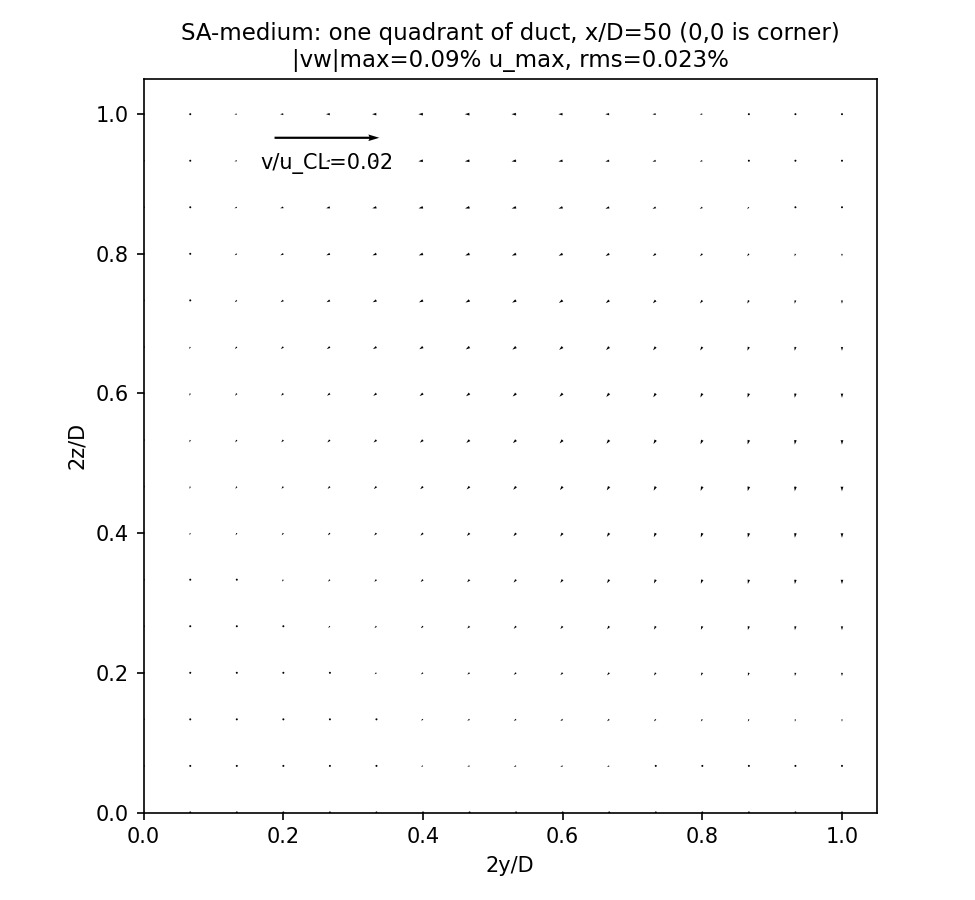
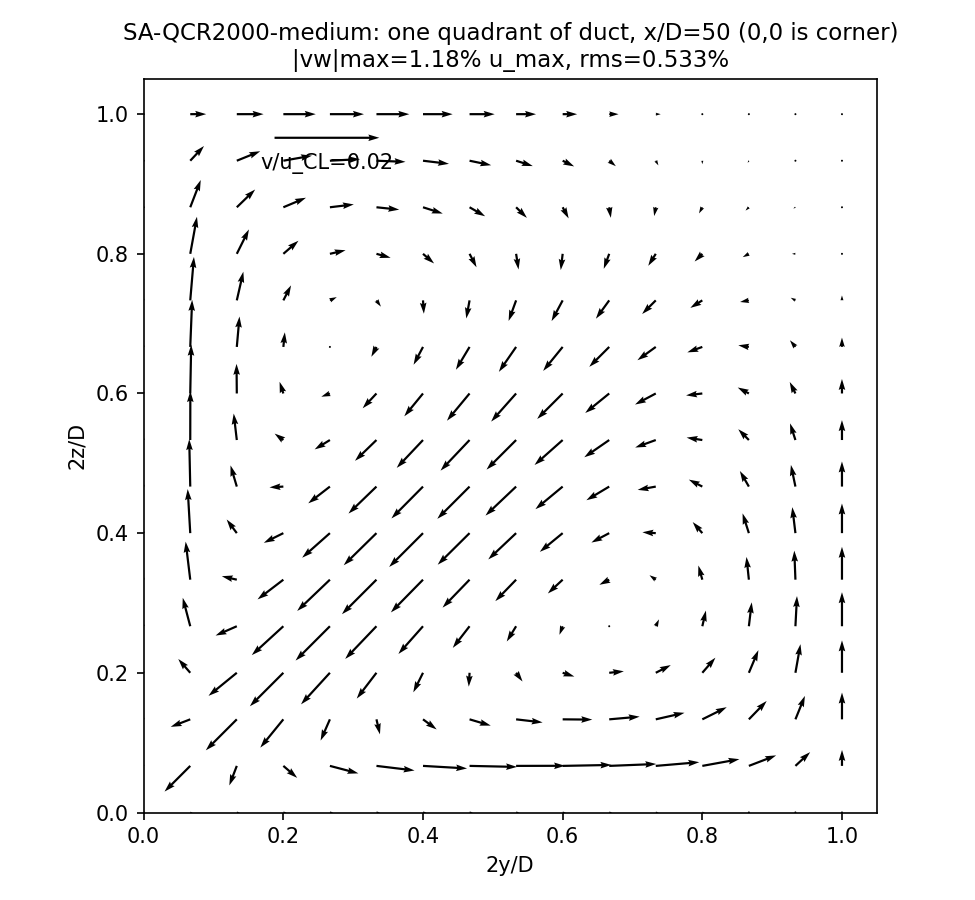
SA alone produces in-plane velocity at the noise floor of the discretization (0.09–0.14% of u_max) — the expected negative-control result for a linear Boussinesq model, which cannot represent stress anisotropy. SA-QCR2000 produces a pair of counter-rotating corner vortices at 1.18–1.19% of u_max, matching the experimentally observed scale (~1%) and topology: an inflow jet along the corner bisector and a return flow along both walls.
27.8.2 Comparison Against Experiment and Reference Codes (medium grid)
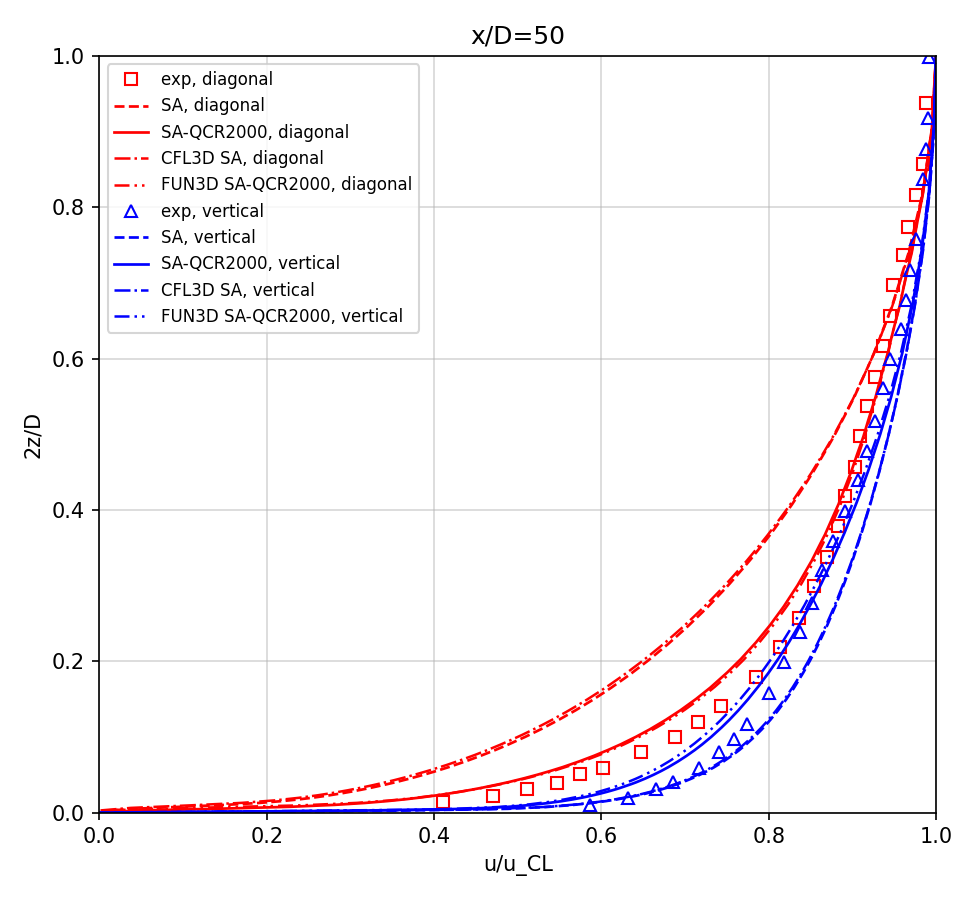
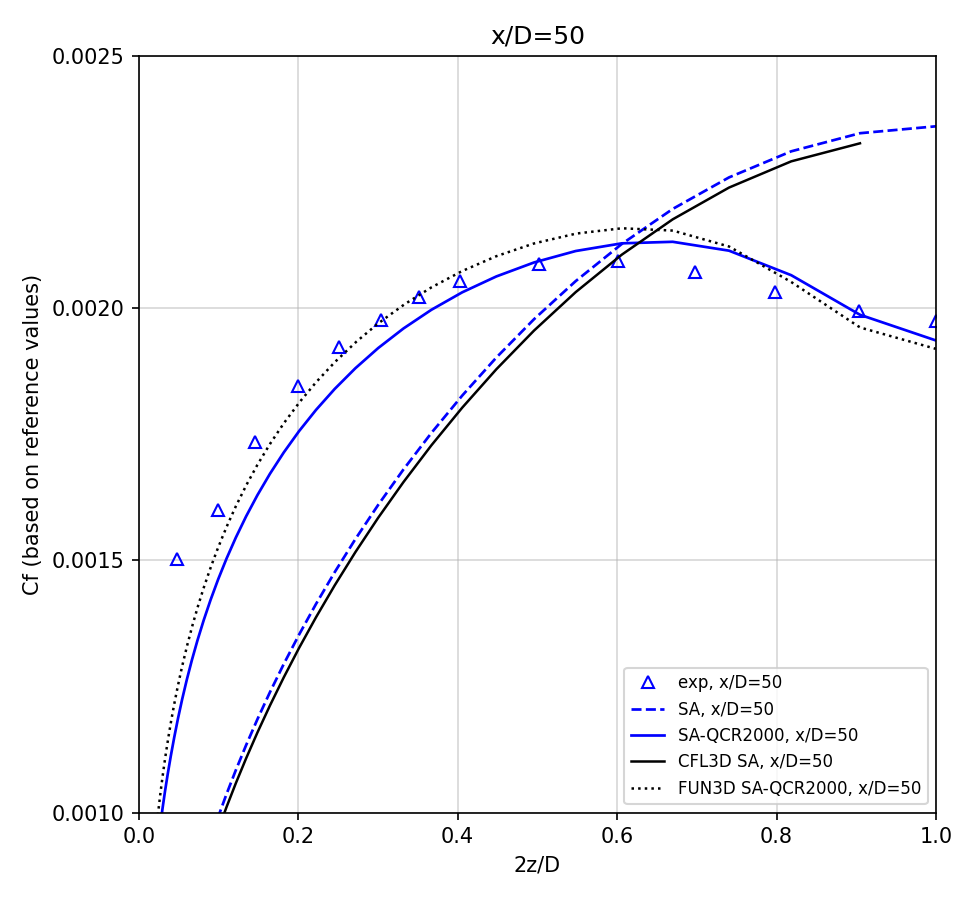
- Wake CFD SA and CFL3D SA agree closely — the velocity and skin-friction profiles are within the plotted resolution of each other. Both codes show the same gap against the experiment (under-predicted diagonal velocity deficit, missing skin-friction inner peak) — this gap is a known limitation of the linear model, not a code-specific error.
- Wake CFD SA-QCR2000 and FUN3D SA-QCR2000 agree closely — velocity profiles overlap; skin friction agrees in peak location and shape, with the reference computation running slightly higher (1–2%) in part of the profile. Against the experiment, SA-QCR2000 reproduces the diagonal-cut velocity deficit and the skin-friction inner peak that SA misses, and matches the experimental data closely at
x/D=40.
27.9 Conclusions and Applicable Scope
- Wake CFD’s SA-QCR2000 implementation generates corner secondary flow at the experimentally observed scale and topology; the SA-only (negative-control) run does not, confirming that the physical mechanism is correctly implemented.
- On the same grid as the reference solutions, Wake CFD SA matches CFL3D SA and Wake CFD SA-QCR2000 matches FUN3D SA-QCR2000 — the residual gap against the experiment is attributable to turbulence-model form error, not to the Wake CFD implementation.
- Grid-convergence was confirmed for SA (coarse and medium agree). For SA-QCR2000, the secondary-flow intensity changes by approximately 13% from coarse to medium; the comparison grid was fixed at medium (matching the reference solutions) rather than extended to a finer grid, so a small residual grid-dependence remains in the absolute magnitude of the QCR2000 secondary flow. This residual uncertainty does not affect the primary pass/fail signal (secondary flow present versus absent), which is an order of magnitude larger than the coarse-to-medium change.
- The inflow boundary layer in this simulation develops from a uniform inlet condition, differing from the experiment’s facility-developed inlet boundary layer; this is the case’s own documented convention, and the fully turbulent judgment stations (
x/D=40, 50) are chosen specifically to be outside the region most sensitive to this difference. - This result applies to a supersonic (
M=3.9), corner-bounded duct flow. It does not by itself establish QCR2000 accuracy for other corner geometries, other Mach numbers, or subsonic conditions. Linear Boussinesq models (SA, standard SST) should not be expected to reproduce corner secondary flow in any geometry — this is a structural model limitation, not a case-specific result.
27.10 References
- Davis, D. O., and Gessner, F. B., “Further Experiments on Supersonic Turbulent Flow Development in a Square Duct,” AIAA Journal, 27(8), 1989, pp. 1023–1030, doi:10.2514/3.10216.
- Spalart, P. R., “Strategies for Turbulence Modelling and Simulations,” International Journal of Heat and Fluid Flow, 21(3), 2000, pp. 252–263.
- NASA Turbulence Modeling Resource, 3D Supersonic Square Duct Validation Case.