21 2D Airfoil Near-Wake — NASA TMR SA and SST Verification
Code-to-code grid-convergence verification of forces and near-wake profiles against CFL3D and FUN3D (Nakayama airfoil, 500-chord farfield)
21.1 Run Provenance and Artifacts
| Item | Value |
|---|---|
| Wake CFD baseline version | 0.23.0 |
| Solver | DBNS |
| Compute device | GPU (NVIDIA RTX 4090) |
| Parallel execution | 1 MPI rank |
| Arithmetic precision | Mixed |
| Run dates | 2026-10-20 |
Results depend on the solver build that produced them. Read every figure in this report together with the version and date above. The solver build used here included uncommitted changes to the 0.21.5 commit, so it cannot be reproduced exactly from the commit alone.
Wall-friction results obtained with the automatic wall treatment on version 0.21.4 and earlier are not comparable with this report: they under-predicted skin friction on this mesh family and are excluded.
21.1.1 Downloadable Files
| File | Description | Format |
|---|---|---|
| Force coefficients | CL, CD, CDp, CDv (drag in counts) for all 20 runs, with iteration counts, convergence flag, and the CFL3D and FUN3D values and differences |
CSV |
| Near-wake minima | Minimum u/U_inf and minimum u'v'/U_inf^2 at the seven wake stations for every run, with the CFL3D, FUN3D, and experimental values and differences |
CSV |
Standalone input decks and solver field files are not published for download.
21.2 Verification Objective
This case verifies Wake CFD against the NASA Turbulence Modeling Resource (TMR) 2D Airfoil Near-Wake verification case. The case is a code-to-code comparison on a family of five nested meshes, so the question is whether Wake CFD solves the SA and SST RANS equations the same way as the reference codes, not whether the models match the experiment. The quantities assessed are:
- lift, total drag, pressure drag, and viscous (friction) drag,
CL,CD,CDp,CDv, and their convergence with mesh refinement - minimum velocity and minimum turbulent shear stress in the near wake, at seven stations behind the trailing edge
- the effect of the second-order reconstruction parameter
κ(U-MUSCL) on the coarse-mesh results
21.3 Reference Solution and Data
21.3.1 Numerical Reference
The references are the CFL3D (version 6.7, structured) and FUN3D solutions published by NASA TMR on the same five meshes, for the Spalart–Allmaras model (SA) and for the SST model. TMR provides forces versus mesh size, wake velocity and Reynolds-shear-stress profiles at x/c = 1.01, 1.05, 1.20, 1.40, 1.80, 2.19, 3.00, and surface Cp and Cf (not compared here). For SST, TMR uses its SST-Vm variant (SSTm).
21.3.2 Experimental Data
The airfoil is the Nakayama (1985) DSMA661 Model A with its originally blunt trailing edge made sharp. The measured wake profiles (NASA TMR) are drawn in the near-wake figures for context. TMR describes this case as a verification of implementation, and SA and SST do not reproduce the measured near wake exactly in any code.
21.4 Simulation Conditions
| Item | Setting |
|---|---|
| Geometry | DSMA661 (Nakayama Model A), sharp trailing edge, chord c = 1 |
| Flow | Steady, fully turbulent, compressible RANS |
| Mach number | 0.088 |
| Reynolds number | 1.2 × 10⁶ based on chord |
| Angle of attack | 0° |
| Freestream state | T = 300 K, p = 62,428.94 Pa, ρ = 0.72495 kg/m³, U = 30.555 m/s (Sutherland viscosity μ = 1.8459 × 10⁻⁵ Pa·s) |
| Air | Ideal gas, R = 287.05 J/(kg·K), Sutherland viscosity, Pr = 0.72 |
| Drag unit | 1 count = 0.0001 in the coefficient |
21.5 Mesh
The meshes are the TMR 500-chord C-grid family: five nested levels (L5 coarsest to L1 finest), each level obtained from the next finer one by removing every other grid line. The TMR files are one-cell-thick extrusions of the two-dimensional grids; they were used as supplied. The minimum wall spacing on L1 is 2.5 × 10⁻⁶ (y+ of about 0.1 to 0.2).
| Level | Points, zone 1 / zone 2 | Cells N |
h = √(1/N) |
|---|---|---|---|
| L1 | 673×897 / 1025×449 | 1,060,864 | 9.709e-4 |
| L2 | 337×449 / 513×225 | 265,216 | 1.942e-3 |
| L3 | 169×225 / 257×113 | 66,304 | 3.884e-3 |
| L4 | 85×113 / 129×57 | 16,576 | 7.767e-3 |
| L5 | 43×57 / 65×29 | 4,144 | 1.553e-2 |
21.6 Boundary and Initial Conditions
| Boundary | Condition |
|---|---|
| Airfoil | No-slip, adiabatic wall; the solver’s default automatic wall treatment |
| Farfield (500 chords) | Riemann farfield at M = 0.088, α = 0°, p = 62,428.94 Pa, T = 300 K |
| Spanwise faces | Symmetry (the extruded cell is one layer thick) |
| Freestream turbulence, SA | ν̃ = 3 ν∞ |
| Freestream turbulence, SST | TMR SST-Vm values: k∞ = 9×10⁻⁹ a∞² and μt/μ = 0.009 (turbulence intensity 8.80×10⁻⁴) |
The flow was initialized automatically from the freestream state.
21.7 Numerical Methods
| Item | Setting |
|---|---|
| Equations | Compressible RANS, steady, finite volume (DBNS) |
| Turbulence models | SA standard (ft2 on, blended Ŝ form, Prt = 0.9); SST (V2003) |
| Convective flux | Roe, second-order |
| Reconstruction | Least-squares reconstruction gradient, no limiter; U-MUSCL κ = 0.5 (the FUN3D value) and κ = 0 (the Wake CFD default) |
| Physical gradient | Green–Gauss |
| Time marching | Implicit pseudo-time, adaptive CFL between 1 and 100 |
| Linear solver | Stationary Block-Jacobi, 30 sweeps (flow) and 20 sweeps (turbulence) per iteration, fixed sweep count |
| Stop rule | CL and CD monitor (window of 1,000 iterations, tolerance 10⁻⁵) or 40,000 iterations |
κ = 0.5 matches the FUN3D input; κ = 0 is the Wake CFD default and is run as a separate family to separate its effect on the coarse-mesh drag.
21.8 Results
21.8.1 Iteration Counts and Termination
Sixteen of the 20 runs (all runs on L5 to L2) stopped on the monitor criterion: about 10,000 iterations on L5 and 20,000 to 22,000 on L2, each taking 20 seconds to 18 minutes. The SA runs on L1 stopped on the monitor after 28,666 (κ=0.5) and 29,528 (κ=0) iterations (about 90 minutes). The two SST runs on L1 reached the 40,000-iteration limit without satisfying the monitor.
The forces of the two SST runs on L1 were stationary: for SST κ=0.5 from 28,000 iterations on, CD stays within 101.64 to 101.66 counts and CL is 0.1563. For SST κ=0, CD fell by only 0.09 counts (from 101.76 to 101.67) over the last 15,000 iterations. The L1 SST values are therefore reported as converged in the forces, but they did not meet the monitor criterion and are marked † below. The residual histories are not reported here.
21.8.2 Force Coefficients
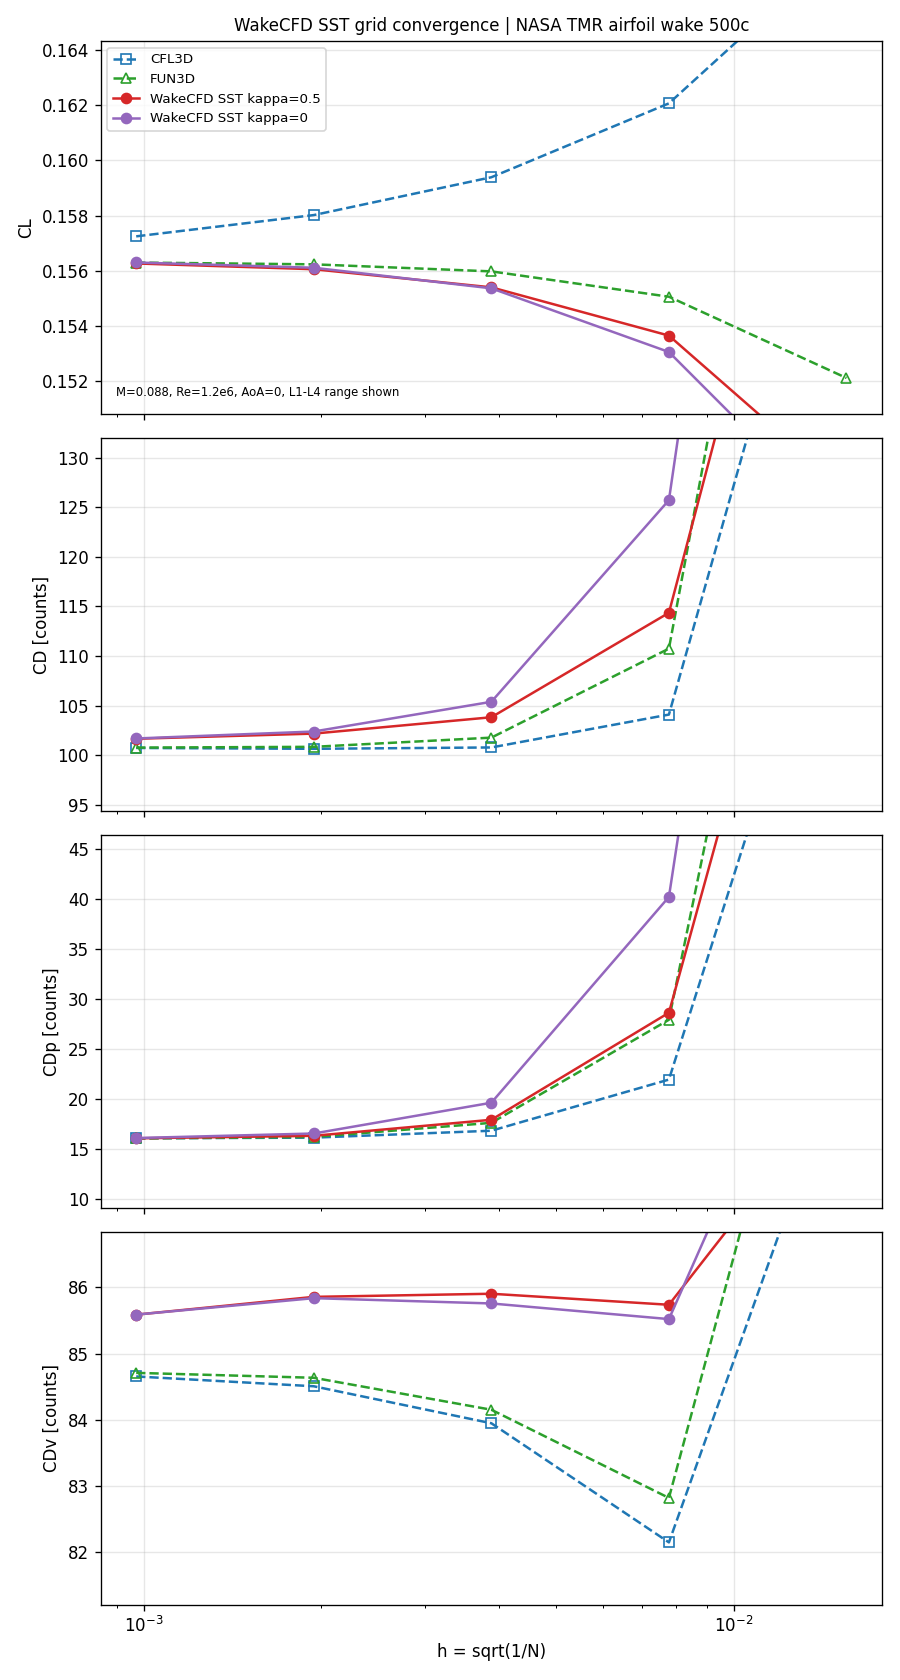
Differences are relative to FUN3D on the same mesh. † marks a run that reached the iteration limit without meeting the monitor criterion. CDp and CDv are the pressure and viscous parts of CD; the complete table, with CFL3D values, is in the downloadable CSV file.
| Model | Level | Iterations | CL |
CD [counts] |
CDp [counts] |
CDv [counts] |
ΔCL |
ΔCD |
ΔCDv |
|---|---|---|---|---|---|---|---|---|---|
SA κ=0.5 |
L5 | 9,893 | 0.1527 | 176.95 | 91.32 | 85.63 | −0.53% | −0.35% | −0.60% |
SA κ=0.5 |
L4 | 15,155 | 0.1572 | 112.55 | 27.51 | 85.04 | −0.43% | −0.21% | −0.27% |
SA κ=0.5 |
L3 | 17,664 | 0.1587 | 102.33 | 17.00 | 85.32 | −0.22% | −0.12% | −0.14% |
SA κ=0.5 |
L2 | 19,729 | 0.1592 | 100.87 | 15.51 | 85.36 | −0.07% | −0.07% | −0.08% |
SA κ=0.5 |
L1 | 28,666 | 0.1595 | 100.68 | 15.33 | 85.35 | +0.00% | −0.01% | −0.03% |
SA κ=0 |
L5 | 9,413 | 0.1518 | 242.86 | 155.09 | 87.77 | −1.13% | +36.77% | +1.88% |
SA κ=0 |
L4 | 14,855 | 0.1570 | 123.92 | 39.06 | 84.86 | −0.52% | +9.87% | −0.48% |
SA κ=0 |
L3 | 18,518 | 0.1588 | 103.96 | 18.70 | 85.26 | −0.15% | +1.47% | −0.22% |
SA κ=0 |
L2 | 20,483 | 0.1593 | 101.09 | 15.73 | 85.36 | −0.01% | +0.15% | −0.08% |
SA κ=0 |
L1 | 29,528 | 0.1595 | 100.71 | 15.36 | 85.35 | +0.02% | +0.02% | −0.03% |
SST κ=0.5 |
L5 | 10,126 | 0.1480 | 182.19 | 93.03 | 89.17 | −2.70% | −12.00% | −3.91% |
SST κ=0.5 |
L4 | 16,611 | 0.1536 | 114.36 | 28.62 | 85.74 | −0.91% | +3.27% | +3.52% |
SST κ=0.5 |
L3 | 19,013 | 0.1554 | 103.81 | 17.91 | 85.90 | −0.37% | +2.02% | +2.08% |
SST κ=0.5 |
L2 | 21,421 | 0.1560 | 102.16 | 16.31 | 85.85 | −0.11% | +1.32% | +1.44% |
SST κ=0.5 |
L1 | 40,000 † | 0.1563 | 101.64 | 16.06 | 85.59 | −0.02% | +0.88% | +1.04% |
SST κ=0 |
L5 | 9,754 | 0.1466 | 248.51 | 156.93 | 91.58 | −3.63% | +20.03% | −1.31% |
SST κ=0 |
L4 | 16,234 | 0.1530 | 125.73 | 40.21 | 85.52 | −1.30% | +13.53% | +3.26% |
SST κ=0 |
L3 | 20,071 | 0.1554 | 105.37 | 19.62 | 85.76 | −0.39% | +3.55% | +1.91% |
SST κ=0 |
L2 | 22,315 | 0.1561 | 102.38 | 16.54 | 85.84 | −0.08% | +1.53% | +1.42% |
SST κ=0 |
L1 | 40,000 † | 0.1563 | 101.67 | 16.09 | 85.59 | +0.00% | +0.91% | +1.04% |
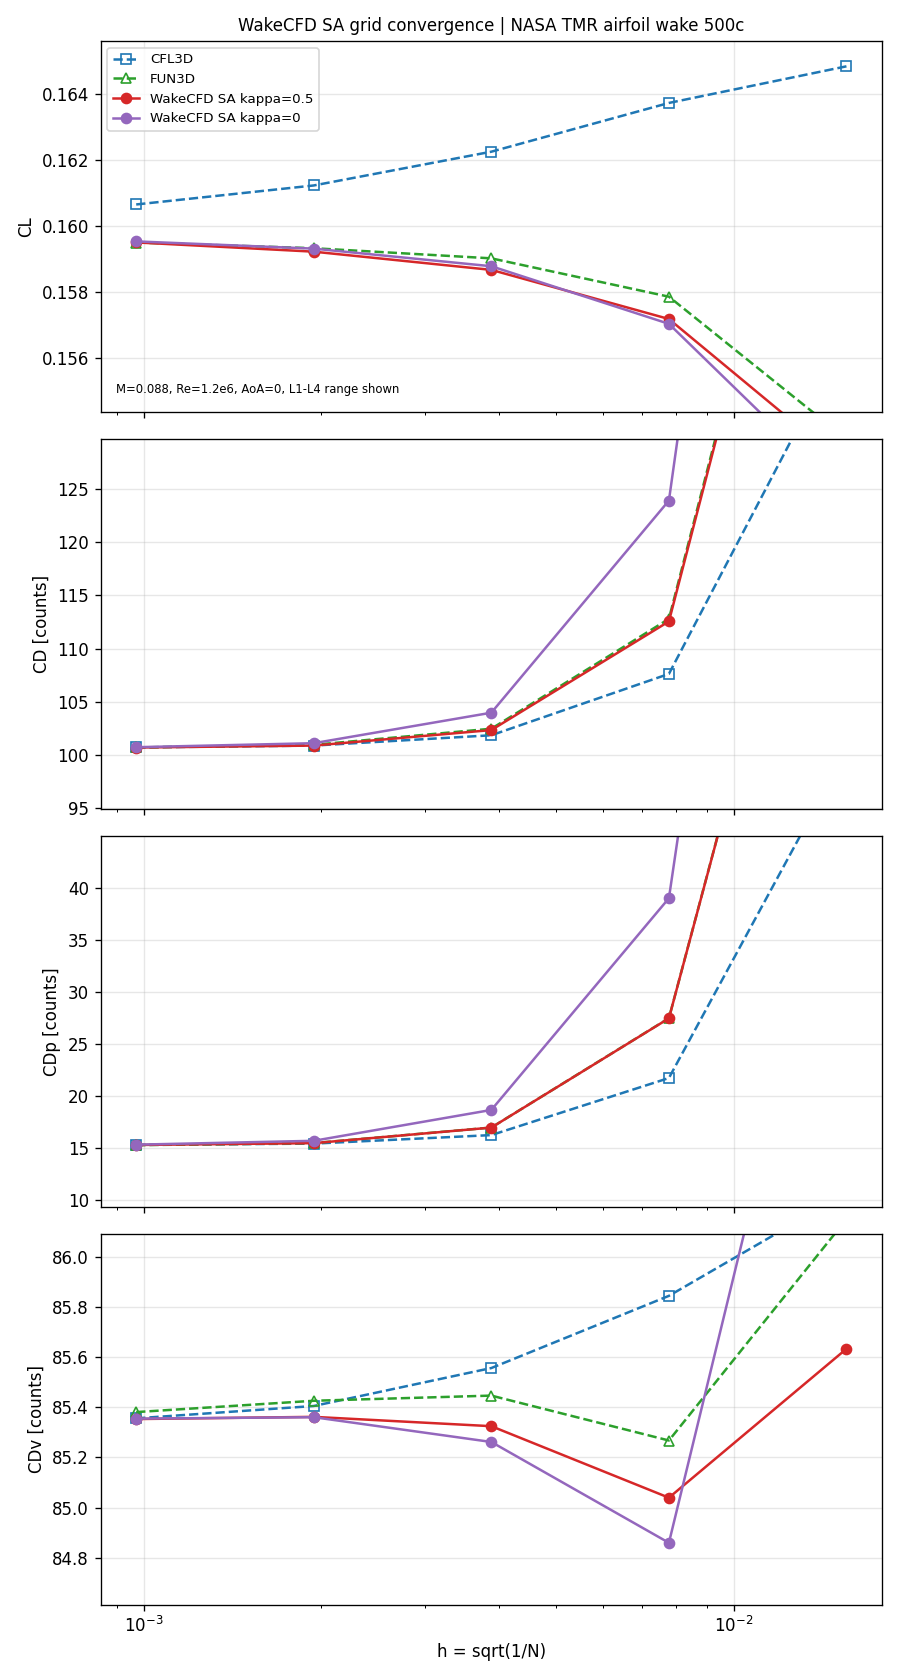
SA. With κ=0.5, Wake CFD follows the FUN3D curve on every level. On L2 the differences are CL −0.07%, CD −0.07%, and CDv −0.08%; on L1, CL +0.00%, CD −0.01%, CDp 15.33 against 15.31 counts, and CDv −0.03%. The viscous drag is nearly flat from L5 to L1 (85.0 to 85.6 counts), as in FUN3D (85.4 to 86.1).
With κ=0, the coarse-mesh drag is far higher (L4: CD +9.87%, CDp 39.06 against 27.51 counts for κ=0.5), and the difference to κ=0.5 shrinks with refinement (L3 +1.47%, L2 +0.15%, L1 +0.02% against FUN3D). CDv hardly depends on κ (L4 −0.48%, L2 −0.08%). The κ setting therefore changes the pressure drag on coarse meshes but not the fine-mesh limit.
SST. Wake CFD’s SST drag is above FUN3D by 1.0% to 3.5% in CDv and, on L2, by 1.3% to 1.5% in CD; on L1 the margin is +0.88% and +0.91% in CD and +1.04% in CDv for κ=0.5 and κ=0. CFL3D shows CDv +1.6% on L2. The viscous-drag curve of Wake CFD’s SST model (85.5 to 89.2 counts) is also flatter than those of the references (FUN3D 82.8 to 84.6 counts, with a minimum at L4). As for SA, κ=0 has a much larger pressure drag on coarse meshes (L4: CD +13.5% against +3.3% for κ=0.5) and the two agree within 1.5% on L2 and to 0.03 counts on L1.
21.8.3 Near-Wake Profiles
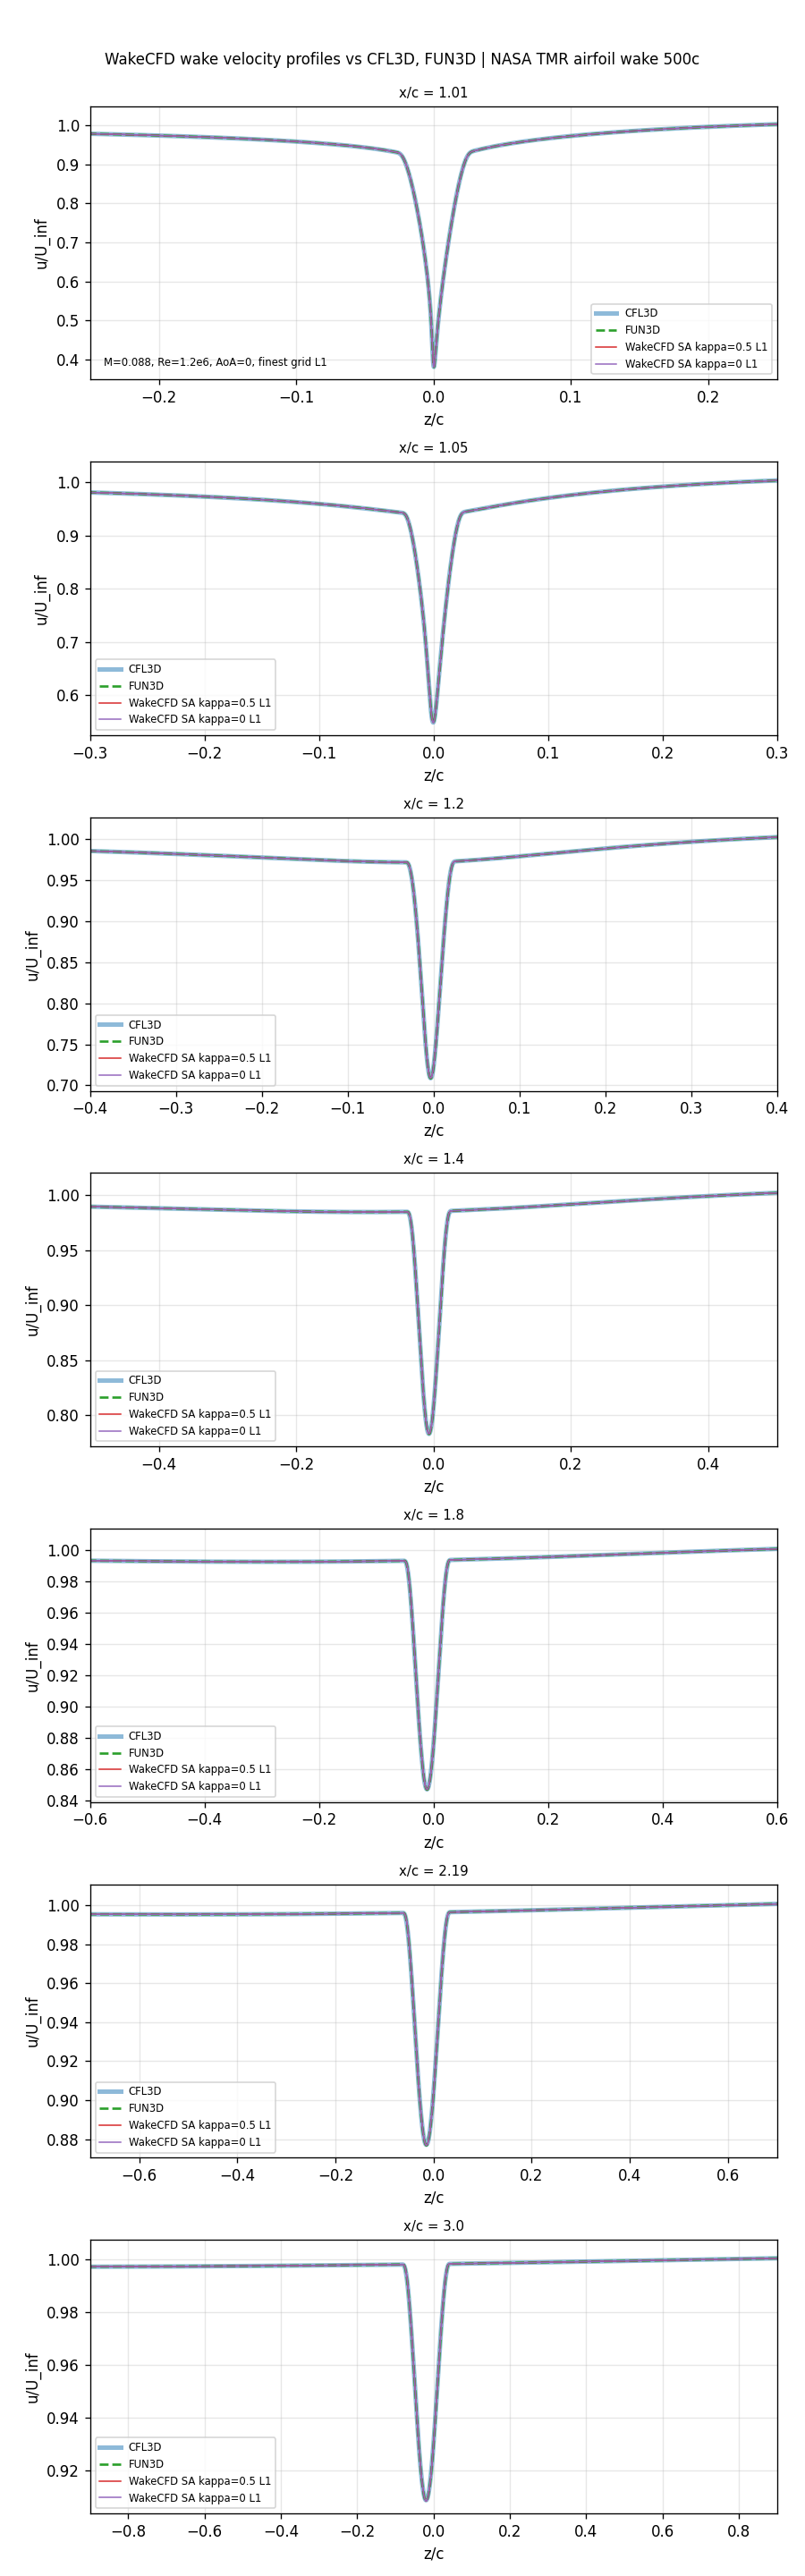
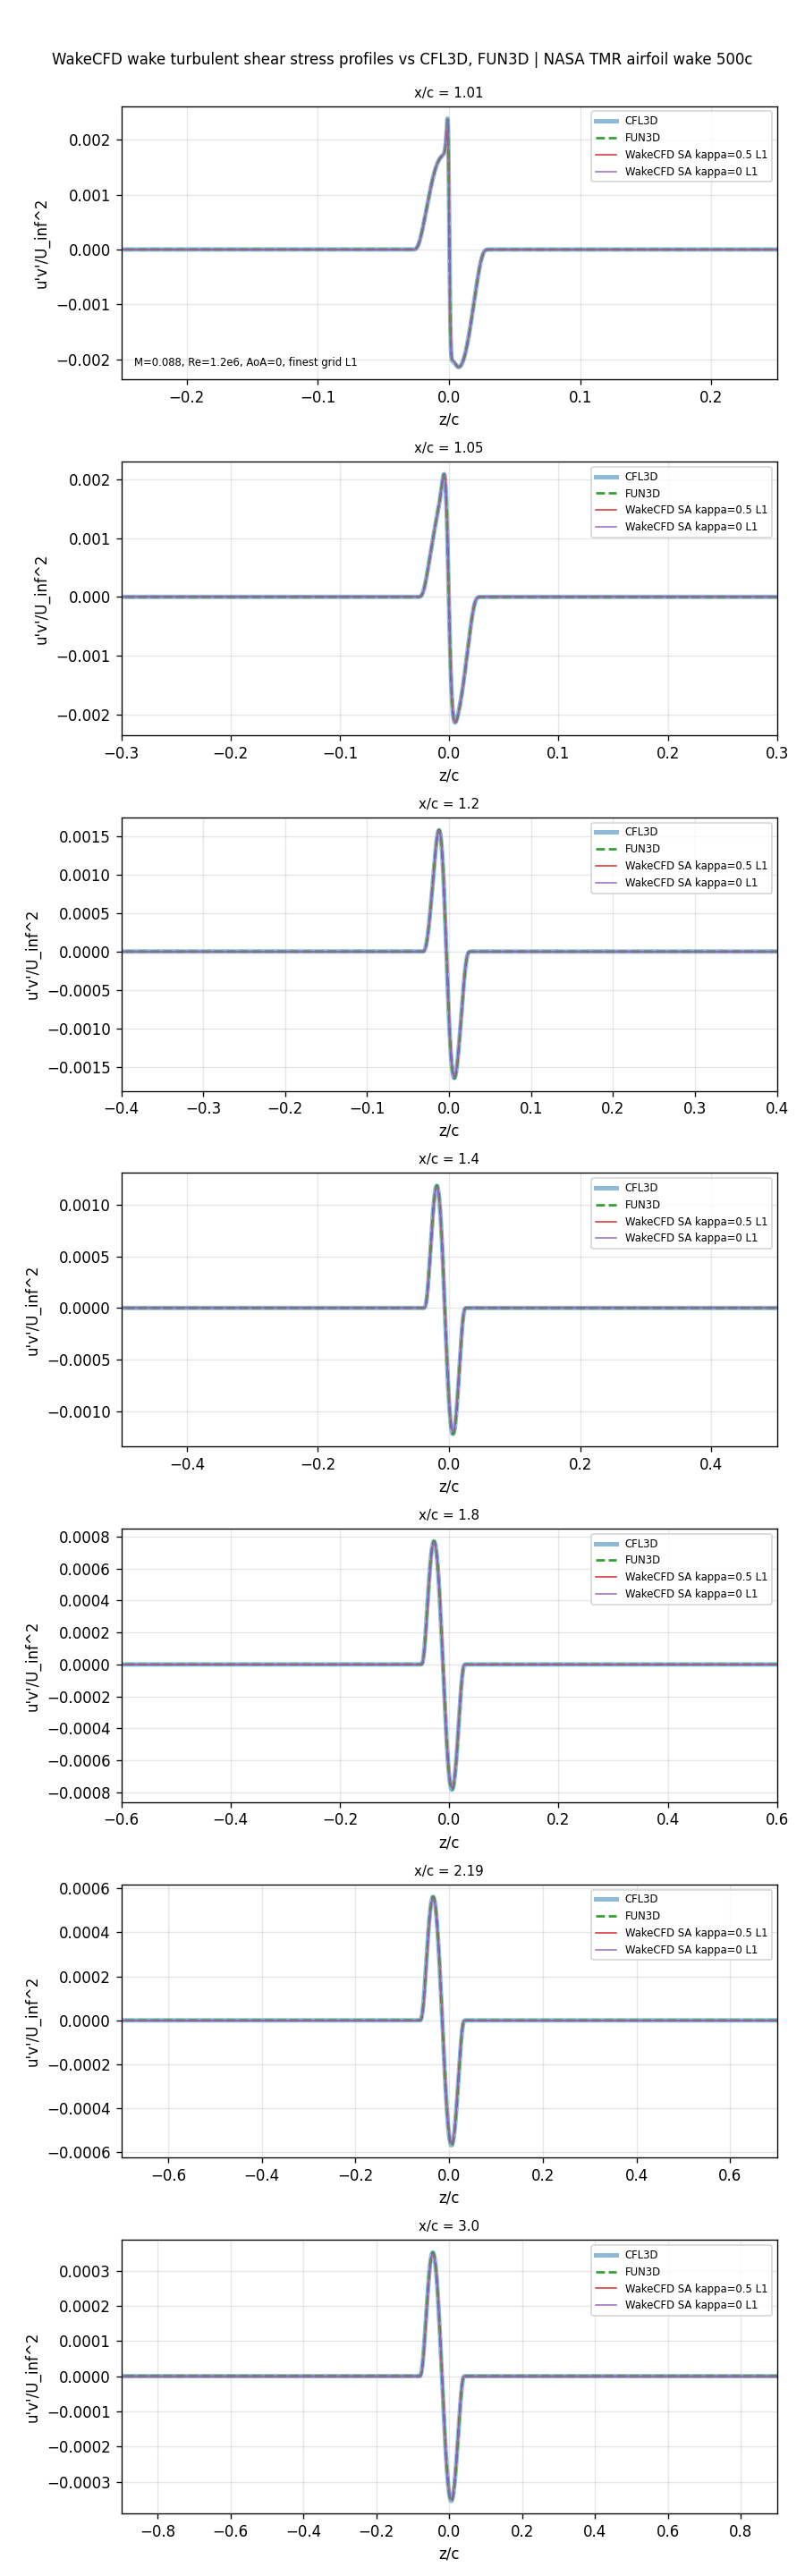
The near-wake profiles of velocity and turbulent shear stress were compared at the seven TMR stations. The Wake CFD shear stress u'v' is computed from the eddy viscosity by the Boussinesq relation, −νt (∂u/∂z + ∂w/∂x)/U∞², using nodal gradients. For SST the turbulent-kinetic-energy contribution is not included in this conversion; whether this explains part of the SST differences below was not checked.
SA, velocity and shear stress profiles on the finest mesh (L1)
SST, velocity and shear stress profiles on the finest mesh (L1)
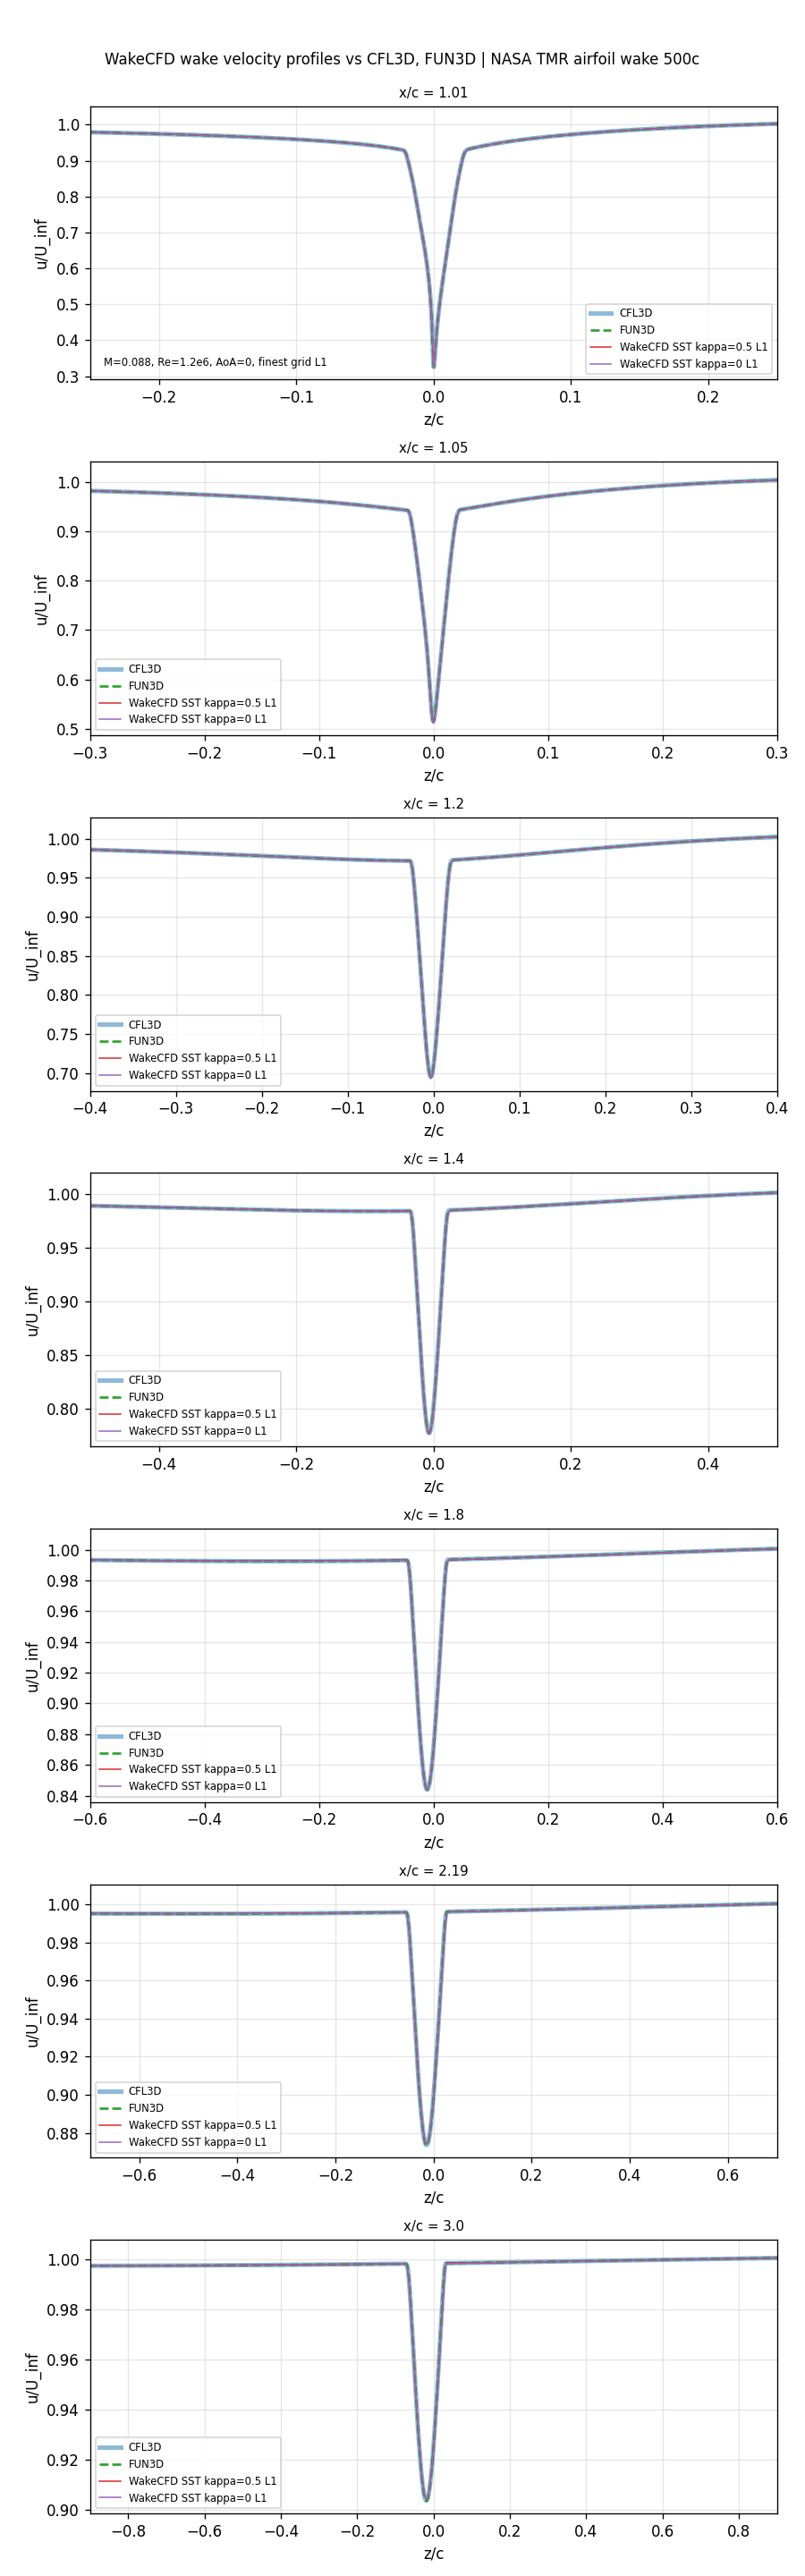
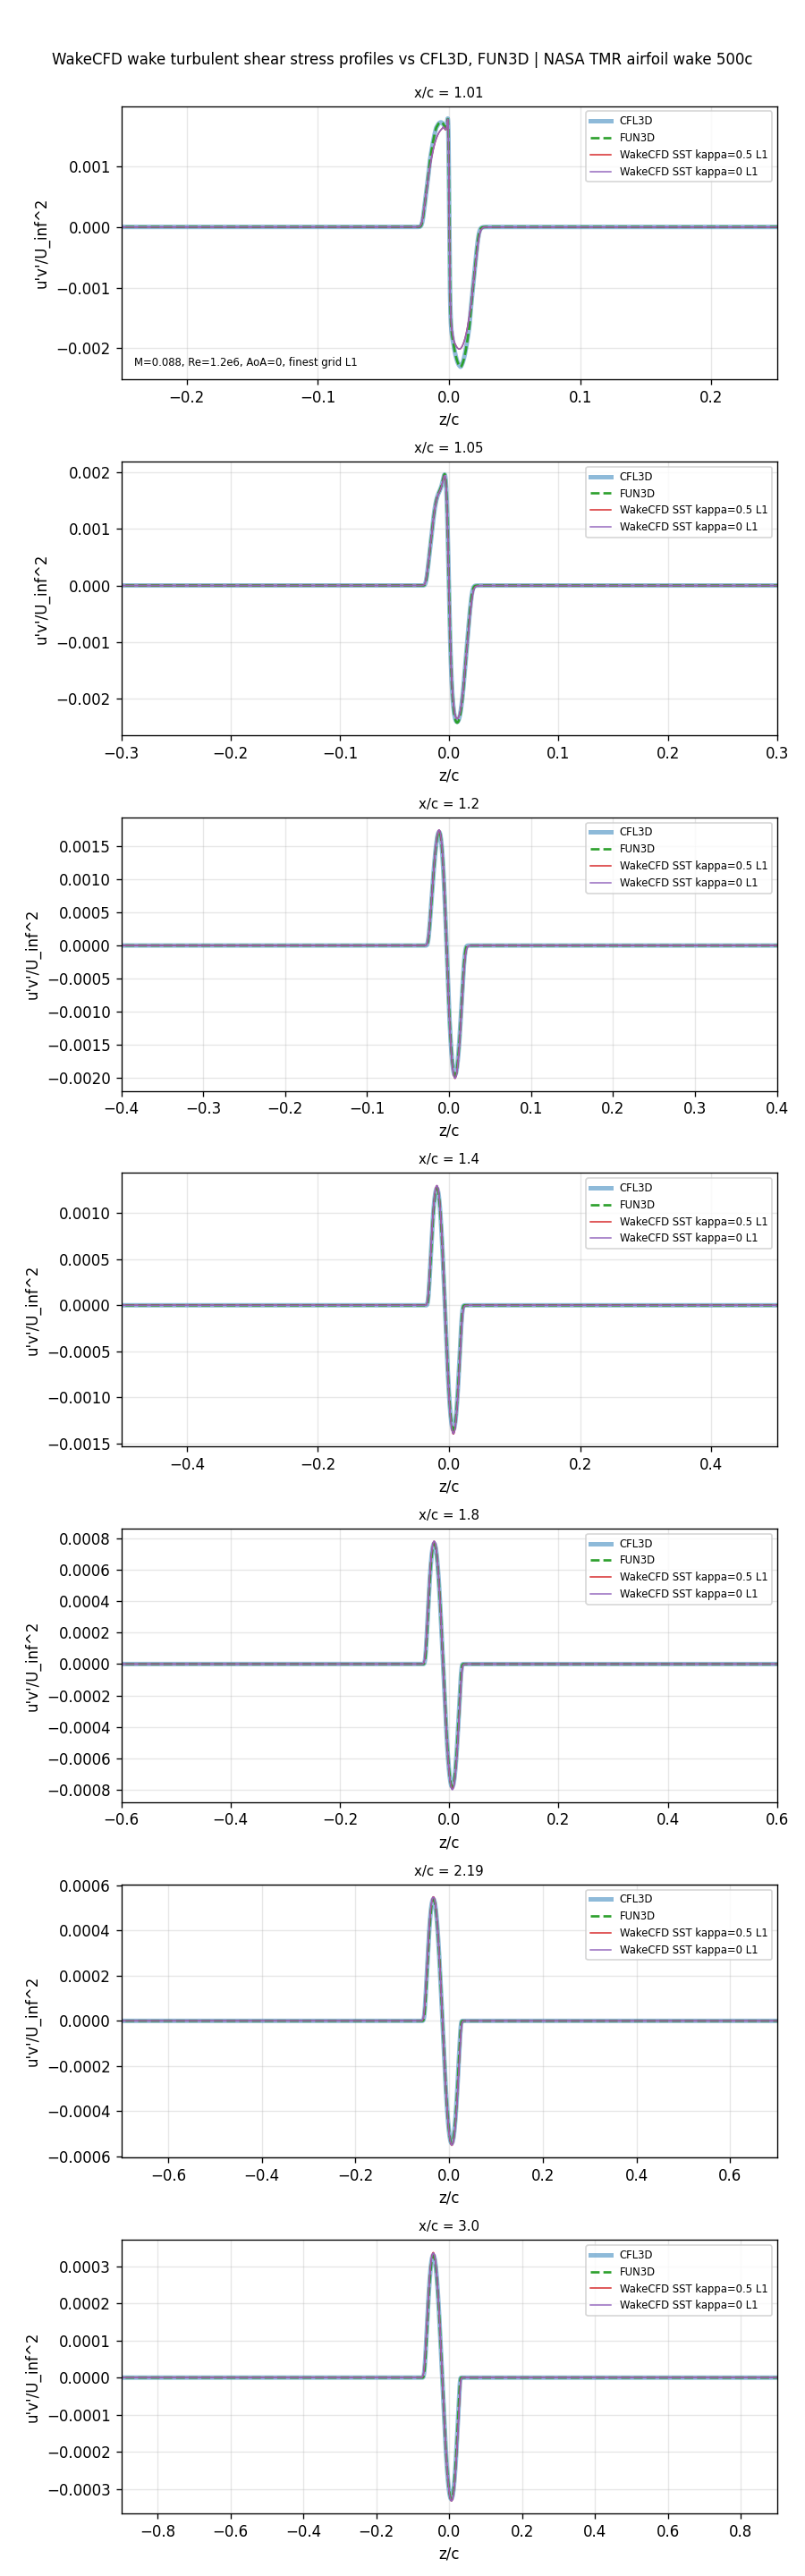
Differences of the finest-mesh (L1) wake minima relative to FUN3D (CFL3D values and all levels are in the downloadable CSV file):
Minimum velocity u/U_inf
| Model | x/c 1.01 | x/c 1.05 | x/c 1.2 | x/c 1.4 | x/c 1.8 | x/c 2.19 | x/c 3.0 |
|---|---|---|---|---|---|---|---|
SA κ=0.5 |
+0.07% | +0.10% | +0.08% | +0.04% | +0.01% | +0.01% | +0.00% |
SA κ=0 |
+0.06% | +0.10% | +0.08% | +0.04% | +0.02% | +0.01% | +0.00% |
SST κ=0.5 |
+0.11% | −0.52% | −0.36% | −0.13% | +0.05% | +0.09% | +0.09% |
SST κ=0 |
+0.11% | −0.52% | −0.35% | −0.13% | +0.04% | +0.09% | +0.11% |
Minimum shear stress u'v'/U_inf^2
| Model | x/c 1.01 | x/c 1.05 | x/c 1.2 | x/c 1.4 | x/c 1.8 | x/c 2.19 | x/c 3.0 |
|---|---|---|---|---|---|---|---|
SA κ=0.5 |
−0.0% | −0.1% | −1.1% | −1.6% | −1.5% | −1.3% | −1.1% |
SA κ=0 |
+0.0% | −0.1% | −1.0% | −1.6% | −1.6% | −1.3% | −1.2% |
SST κ=0.5 |
−12.9% | −3.0% | +1.9% | +3.1% | +1.8% | +1.7% | +1.5% |
SST κ=0 |
−12.9% | −2.8% | +1.8% | +2.8% | +2.3% | +1.5% | +1.6% |
The SA minimum velocity is within 0.1% of FUN3D at every station, and the minimum shear stress is within 0.1% up to x/c = 1.05 and 1.1% to 1.6% lower farther downstream; κ=0 and κ=0.5 cannot be told apart on L1. The SST minimum velocity is within 0.6% of FUN3D, but the minimum shear stress directly behind the trailing edge is 12.9% lower at x/c = 1.01 (3.0% at x/c = 1.05) and then 1.5% to 3.1% higher at x/c ≥ 1.2. The velocity profile agrees while only the near-trailing-edge shear stress differs; together with the +1% CDv, this points to a model-implementation difference, which was not identified.
Comparison with the experiment (Nakayama)
The same profiles are shown against the measured wake. The Wake CFD curves are the finest-mesh (L1) results for κ=0.5 and κ=0.
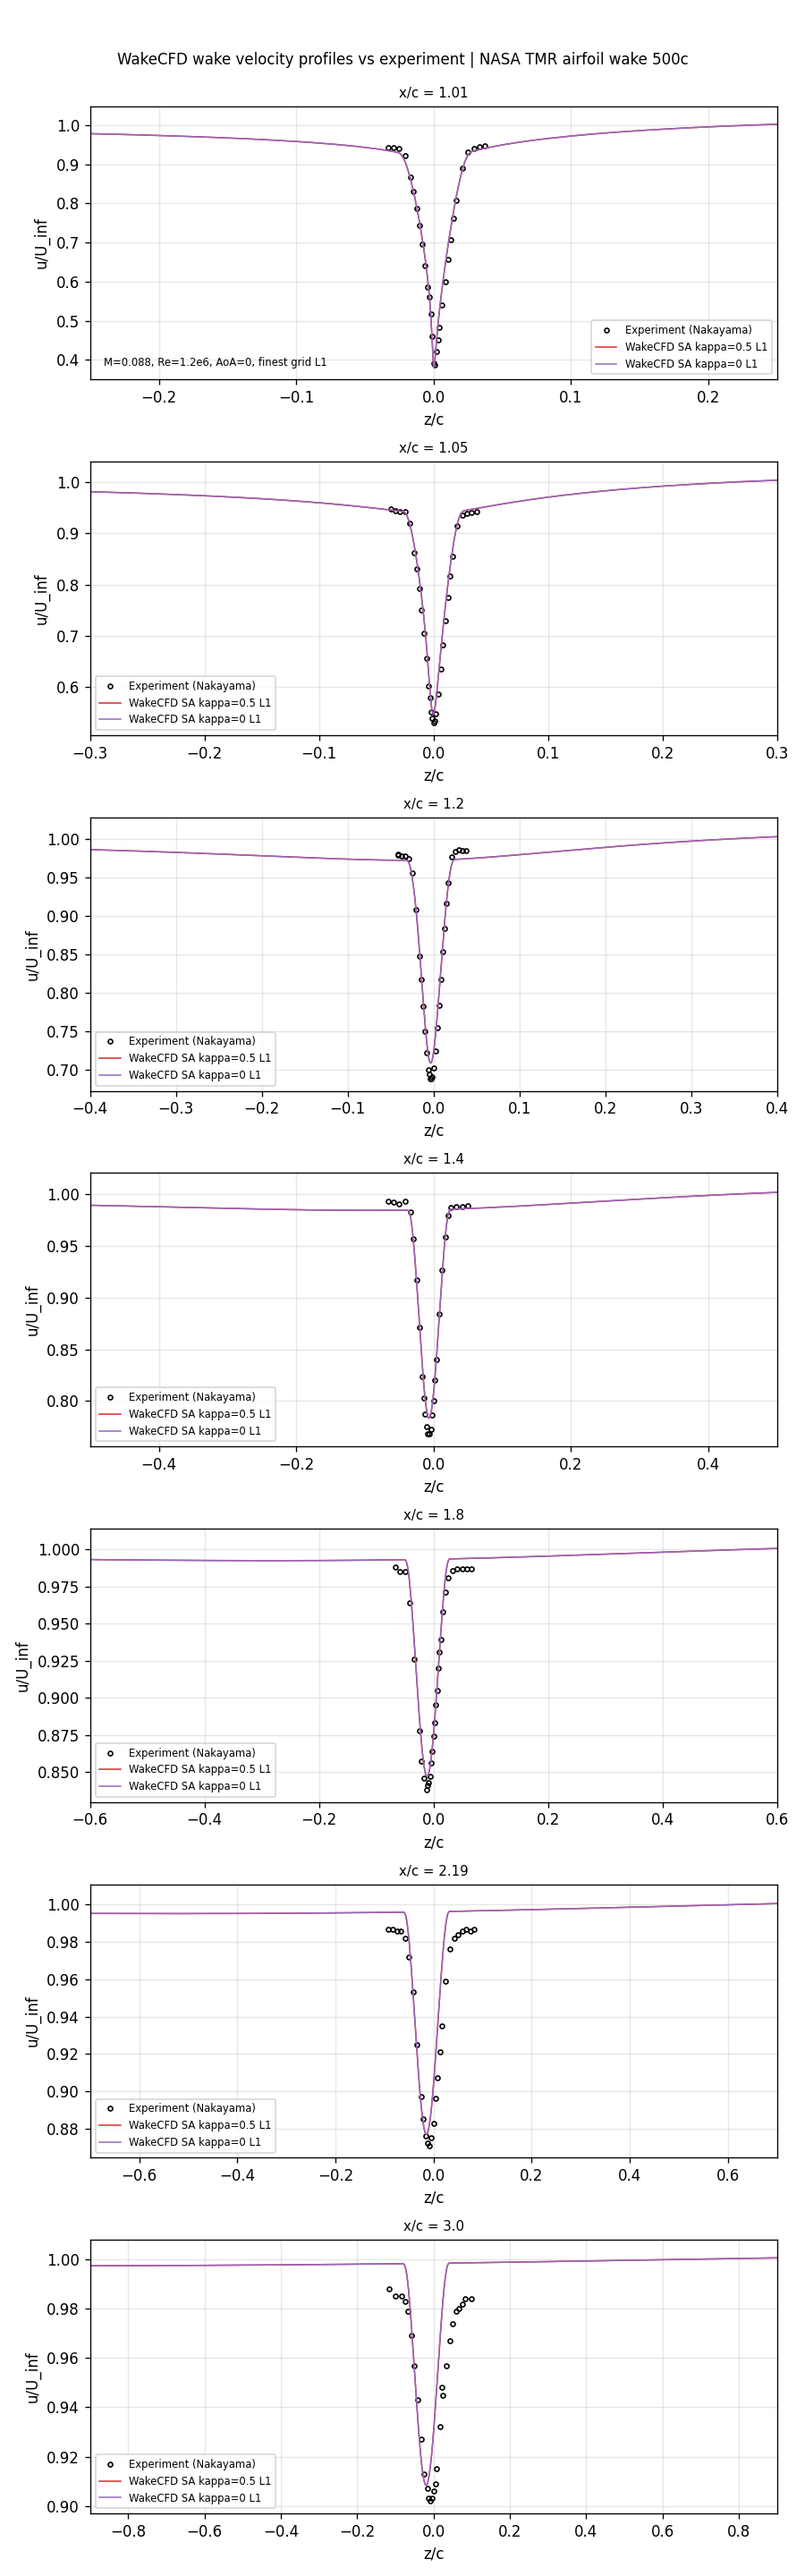
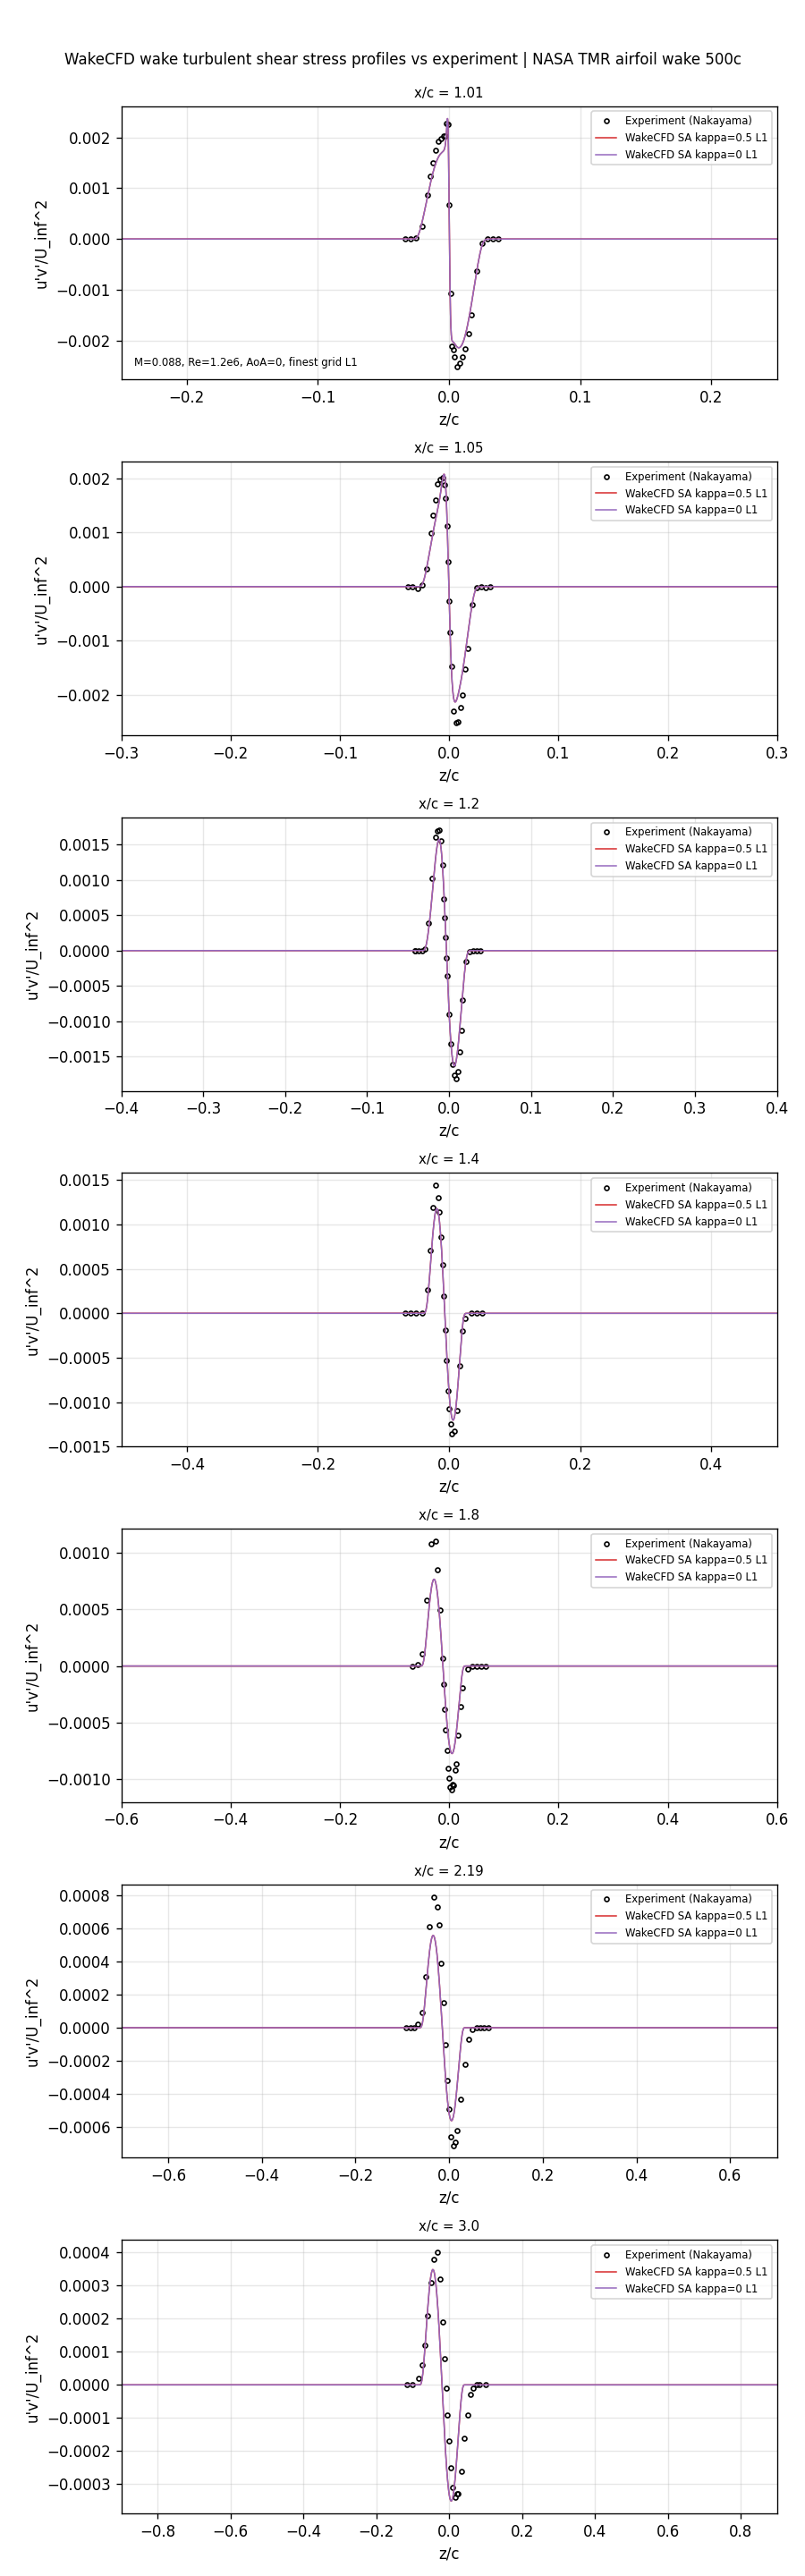
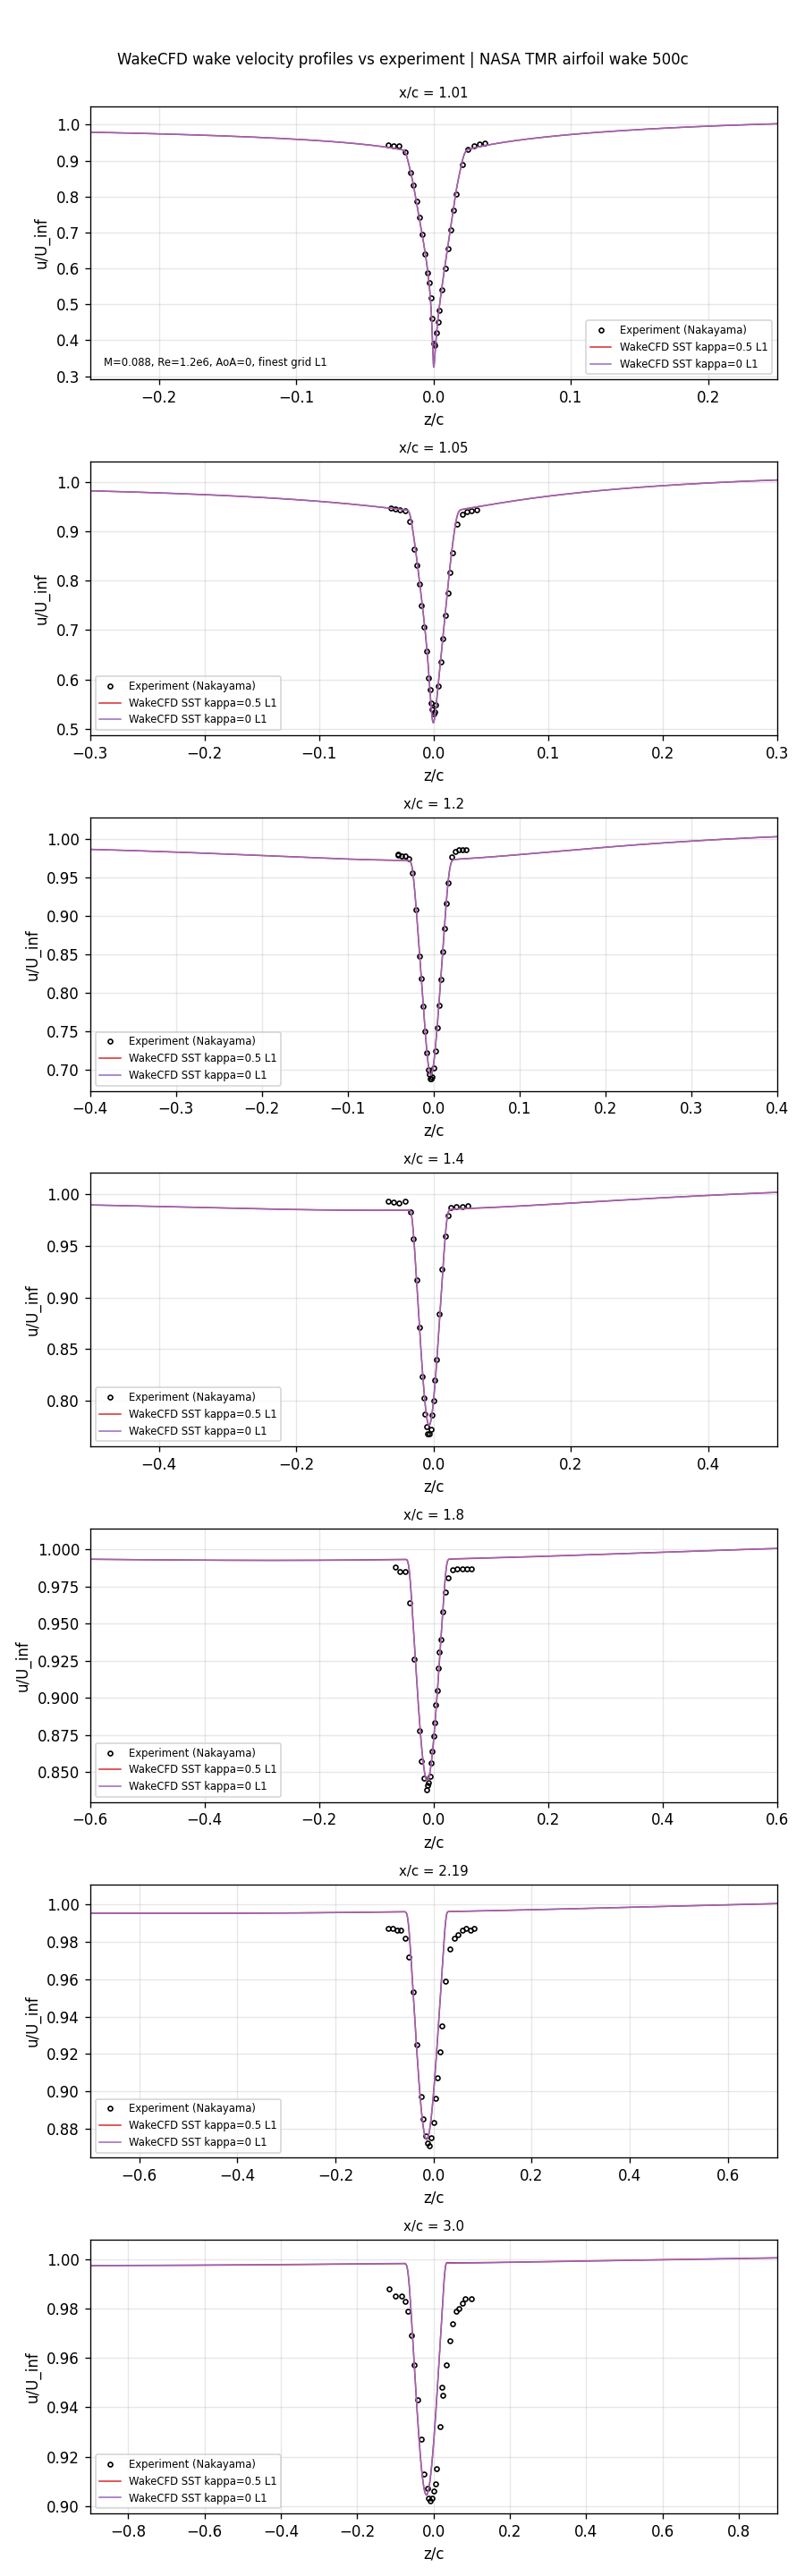
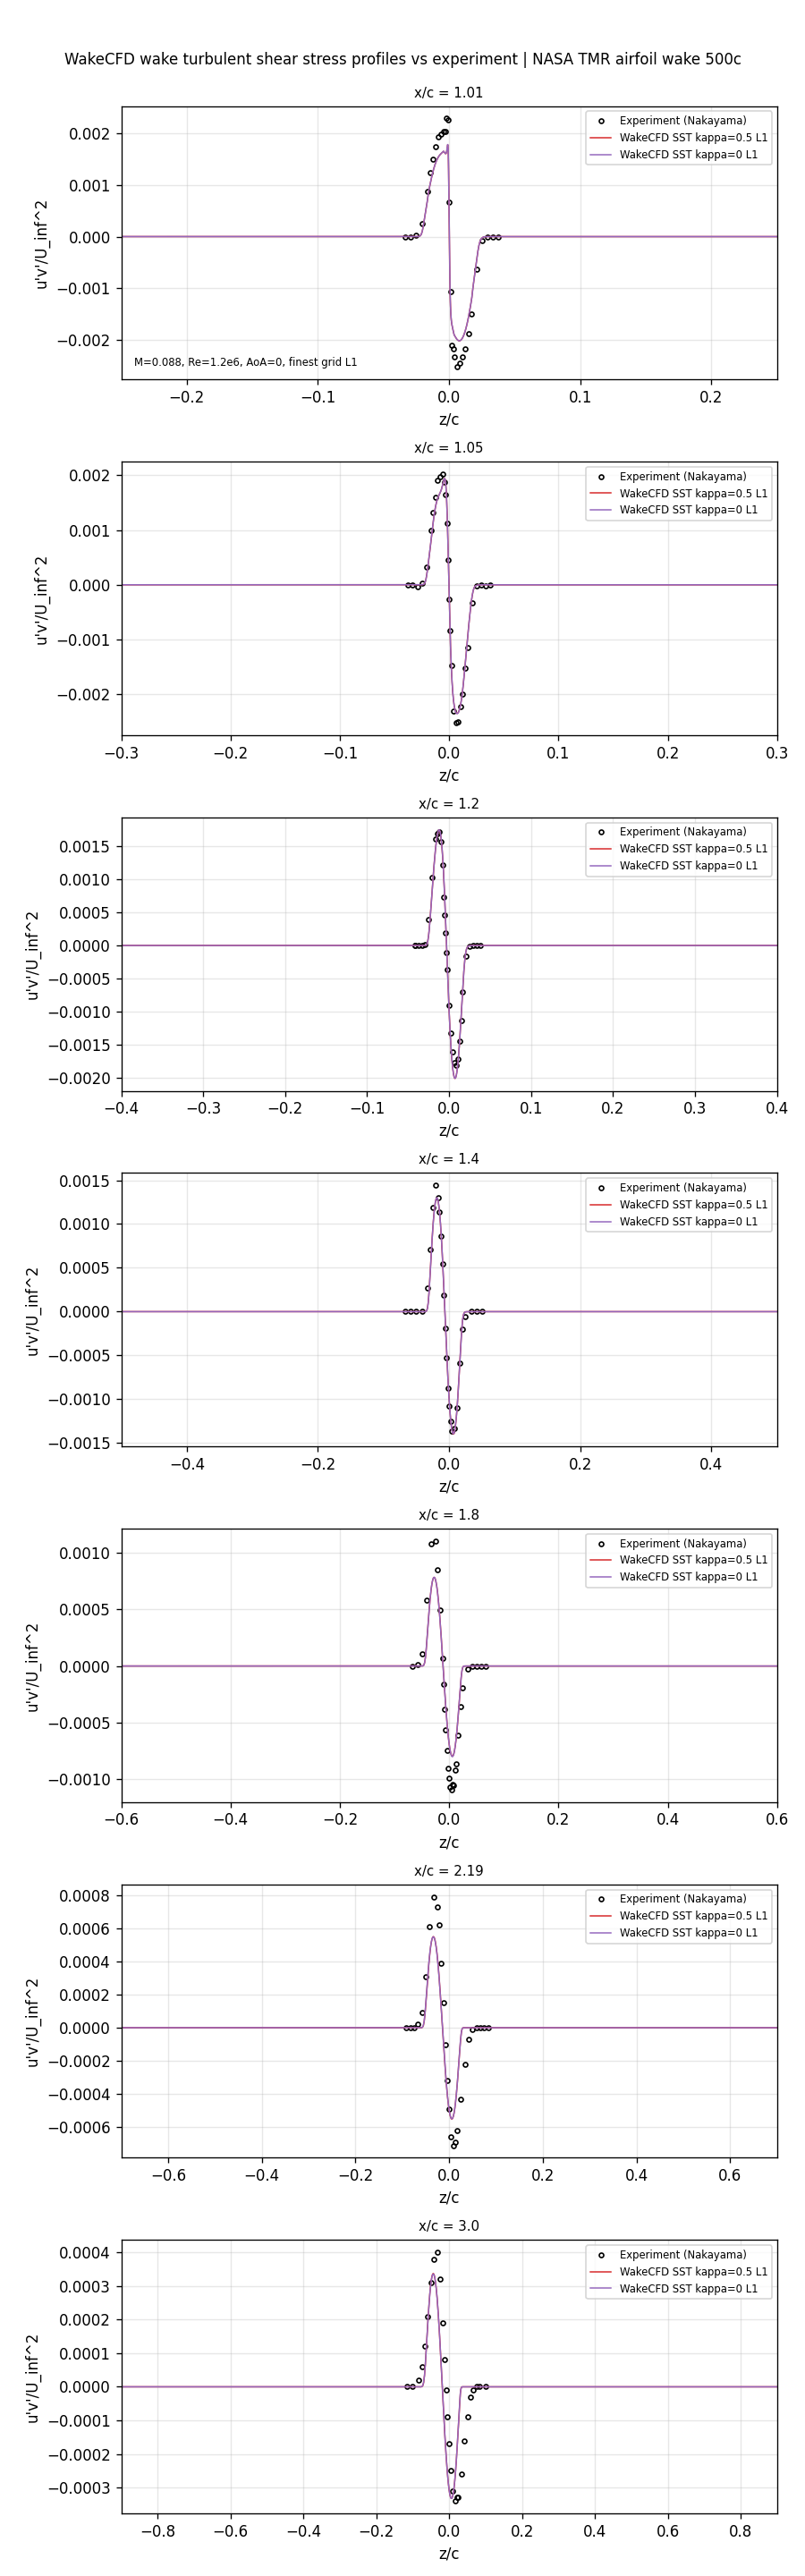
Against the experiment, the finest-mesh minimum velocity of SA differs from the measurement by −1.2% at x/c = 1.01, +1.1% to +3.3% at 1.05 to 1.8, and +0.7% at 2.19 and beyond; SST has a much deeper deficit right behind the trailing edge (−15.7% at x/c = 1.01, measured 0.386 against 0.326) and is within +0.3% to +1.1% from x/c = 1.2 on. The minimum shear stress of both models is 20% to 29% below the measurement at x/c = 1.8 to 2.19. The reference codes give the same behavior, so this is a feature of the models and not a discrepancy of Wake CFD.
21.9 Conclusions and Applicable Scope
- With the SA model and
κ = 0.5, Wake CFD agrees with FUN3D on forces and the near-wake minima at every mesh level:CL,CD, andCDvwithin 0.08% onL2and within 0.03% onL1; the minimum wake velocity within 0.1% and the minimum shear stress within 1.6% at all stations onL1. - The
κ = 0reconstruction gives much higher pressure drag on the coarse meshes (+9.9% inCDonL4) but converges to theκ = 0.5result byL2(within 0.15%), and to 0.03 counts inCDonL1. - The SST model agrees with the references in
CL(within 0.11% onL2) and in the minimum wake velocity (within 0.6%). Its viscous drag is higher than FUN3D by 1.0% onL1(1.4% onL2), and its minimum shear stress directly behind the trailing edge is 12.9% lower. These differences did not shrink fromL2toL1, so they are not discretization error; their cause was not identified, and SST is therefore not verified to the level of SA in this case. - The two SST runs on the finest mesh did not satisfy the monitor criterion within 40,000 iterations; their forces were stationary to within the changes quoted under Convergence History.
- The
automaticwall treatment was used on a mesh withy+below 1 (finest level about 0.1 to 0.2). The results apply to the0.21.5build that includes uncommitted changes (see Run Provenance and Artifacts) and to the mesh family used. - The case is two-dimensional, subsonic (
M = 0.088), attached, and fully turbulent. The results do not support conclusions for separated flow, transition, stronger compressibility, or turbulence models other than SA and SST.
This case shows that Wake CFD’s SA implementation reproduces the forces and the near-wake structure of the mature reference codes on this airfoil to within 0.1% to 1.6% on the finest mesh, and that its SST implementation reproduces them to within about 1% in the forces with an unexplained offset in the wall friction and the shear stress near the trailing edge. It establishes a baseline for this range of conditions and not an absolute accuracy guarantee.
21.10 References
- NASA Turbulence Modeling Resource: 2D Airfoil Near-Wake Verification Case (500c)
- NASA Turbulence Modeling Resource: SA results for the 2D airfoil near wake (500c)
- NASA Turbulence Modeling Resource: 2D Airfoil Near-Wake grids (500c)
- NASA Turbulence Modeling Resource: Airfoil Near-Wake Validation Case
- Nakayama (1985), DSMA661 Model A airfoil near-wake measurements, as documented in the NASA TMR pages above.