13 2D Planar Mixing Layer — SA/SST Validation
Comparison of mean velocity and Reynolds shear stress against the Delville (1989) experiment and CFL3D reference solutions
13.1 Run Provenance and Artifacts
| Item | Value |
|---|---|
| Wake CFD baseline version | 0.22.2 |
| Solver | DBNS |
| Compute device | GPU (NVIDIA RTX A6000) |
| Parallel execution | 1 MPI rank |
| Arithmetic precision | FP64 |
| Run date | 2026-09-09 |
Results depend on the solver build that produced them. Read every figure in this report together with the version and date above — re-running the same input on a later build may give different numbers.
13.1.1 Downloadable Files
Not available: standalone input decks and solver result files have not yet been published for download.
13.2 Validation Objective
This case simulates a planar, incompressible free-shear mixing layer formed by two parallel streams (U1=22.40 m/s, U2=41.54 m/s) developing from separate splitter-plate boundary layers, using the Spalart–Allmaras (SA) and SST turbulence models. It compares Wake CFD against the NASA Turbulence Modeling Resource (TMR) Delville mixing-layer case, which provides both the Delville et al. (1989) experimental data and CFL3D reference solutions for each turbulence model on the same mesh family. It validates Wake CFD for:
- mean-velocity and Reynolds-shear-stress (
u'v') prediction across the mixing layer with SA and SST - grid convergence toward the reference solution
- code-to-code agreement with CFL3D for the same turbulence model, which isolates model accuracy from implementation accuracy
13.3 Reference Solution and Data
| Item | Setting |
|---|---|
| References | Delville et al. (1989) experiment; CFL3D (SA and SST), published by NASA TMR |
13.4 Simulation Conditions
| Item | Setting |
|---|---|
| Geometry | Two parallel ducts (asymmetric length, to match the reported inlet boundary-layer thickness) separated by a splitter plate, merging into a single free-shear domain |
| Analysis | Steady, compressible DBNS, RANS (SA and SST, v2003, production = strain, run independently) |
| Fast stream | U1 = 41.54 m/s |
| Slow stream | U2 = 22.40 m/s |
Freestream turbulence input follows each reference code’s convention: SA uses the community-standard nu_factor=3 (matching the CFL3D/FUN3D sample inputs), and SST uses the experimentally measured turbulence intensity (Tu≈0.3%), which differs from the CFL3D/FUN3D SST reference’s convention value (Tu=0.064%). This difference in freestream input, not model or code accuracy, is the most likely source of any residual disagreement at the reference near the free-stream edges of the profiles.
13.5 Mesh
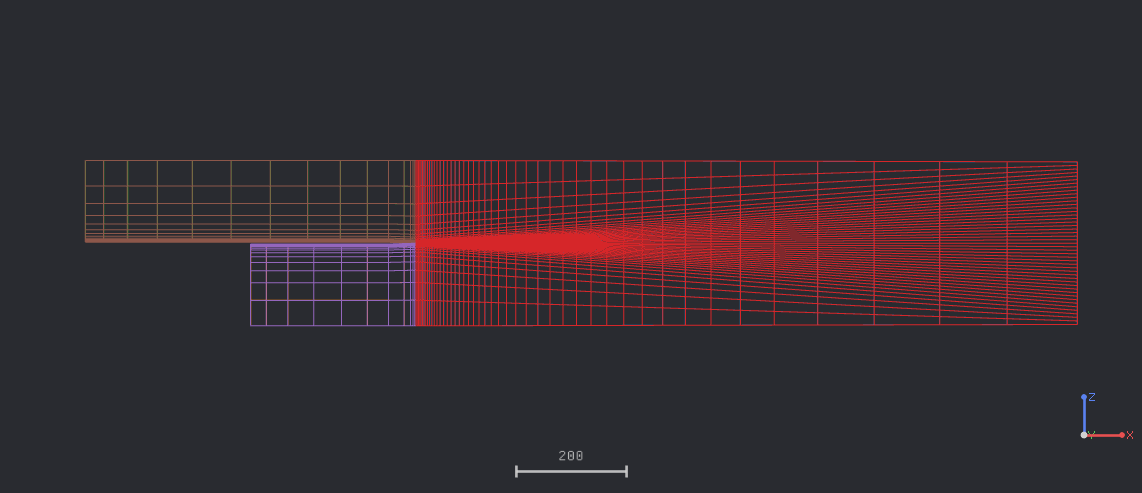
The figure shows the coarsest mesh (L1, 2,636 cells) enlarged around the splitter plate. The upper duct (z>0) is the long one (plate length 600 mm, fast stream 41.54 m/s) and the lower duct (z<0) is the short one (plate length 300 mm, slow stream 22.40 m/s). Behind the plate (x>0) the cells are clustered in the mixing-layer region.
| Item | Setting |
|---|---|
| Mesh | Unstructured quadrilateral, single-zone (one-cell spanwise extrusion), four-level nested grid-convergence family (SA: L1–L4, 2,636–168,704 cells; SST: L1–L5, 2,636–674,816 cells) |
13.6 Boundary and Initial Conditions
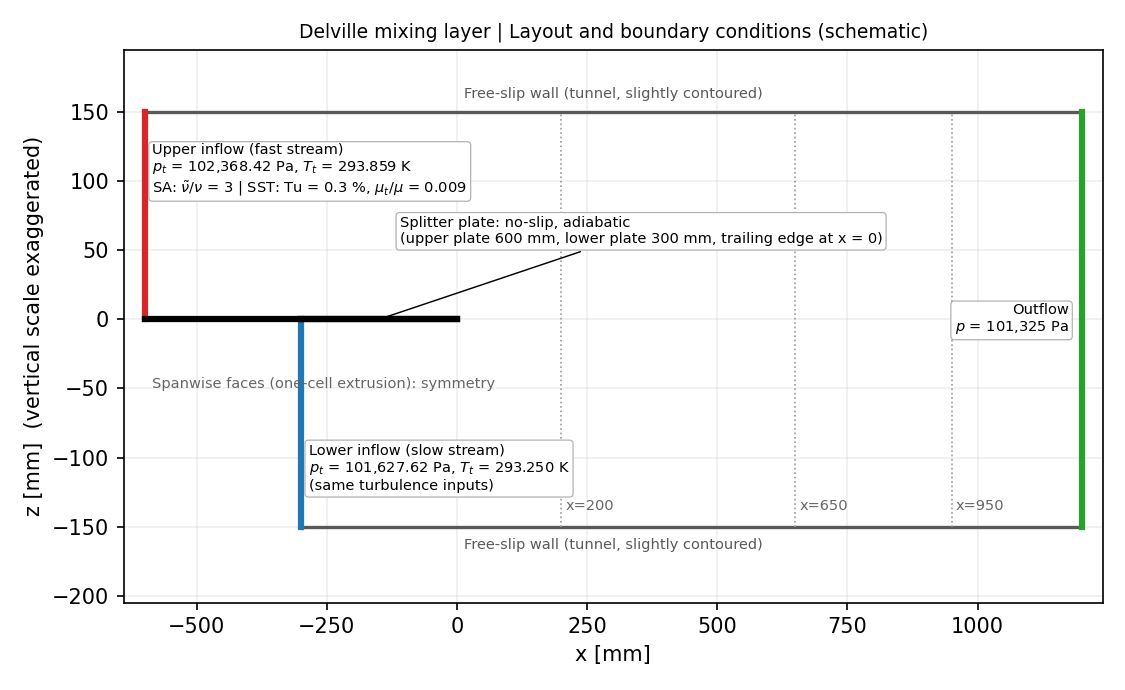
The schematic was drawn from the simulation inputs and the geometry published by NASA TMR (grid units in millimetres, splitter-plate trailing edge at x = 0, tunnel width 300 mm, outflow at x = 1200 mm); the vertical scale is exaggerated.
| Boundary | Condition |
|---|---|
Upper inflow (fast stream, z > 0) |
Total-pressure inlet, p_t = 102,368.42 Pa, T_t = 293.859 K, flow direction +x |
Lower inflow (slow stream, z < 0) |
Total-pressure inlet, p_t = 101,627.62 Pa, T_t = 293.250 K, flow direction +x |
| Outflow | Pressure outlet, back pressure 101,325 Pa |
| Tunnel walls (top and bottom) | Free-slip wall, slightly contoured so that the streamwise pressure gradient is close to zero downstream of x = 0 |
| Splitter plate (upper, lower, trailing edge) | No-slip, adiabatic wall |
| Spanwise faces | Symmetry (the mesh is a one-cell extrusion) |
The two streams enter through separate total-pressure inflows; the boundary layers on the two sides of the plate develop naturally along plates of different length (upper plate 600 mm, lower plate 300 mm), which sets the different boundary-layer thicknesses at the trailing edge. The total pressures correspond to the pressure ratios in the reference FUN3D input (1.00299 and 1.01031 of the reference pressure).
Freestream turbulence at both inflows: for SA, nu_factor = 3; for SST, a turbulence intensity of 0.3% with an eddy-viscosity ratio of 0.009. The initial field is uniform, with M = 0.12107, p = 101,325 Pa, T = 293 K, and flow direction +x.
13.7 Numerical Methods
| Item | Setting |
|---|---|
| Convective scheme | Roe |
| Gradient method | Green–Gauss |
| Time integration | Euler implicit |
| CFL | Constant, 5.0 |
| Convergence criterion | Absolute residual ≤ -15 (log10 RMS of the flow-equation residual; deep convergence) |
13.8 Results
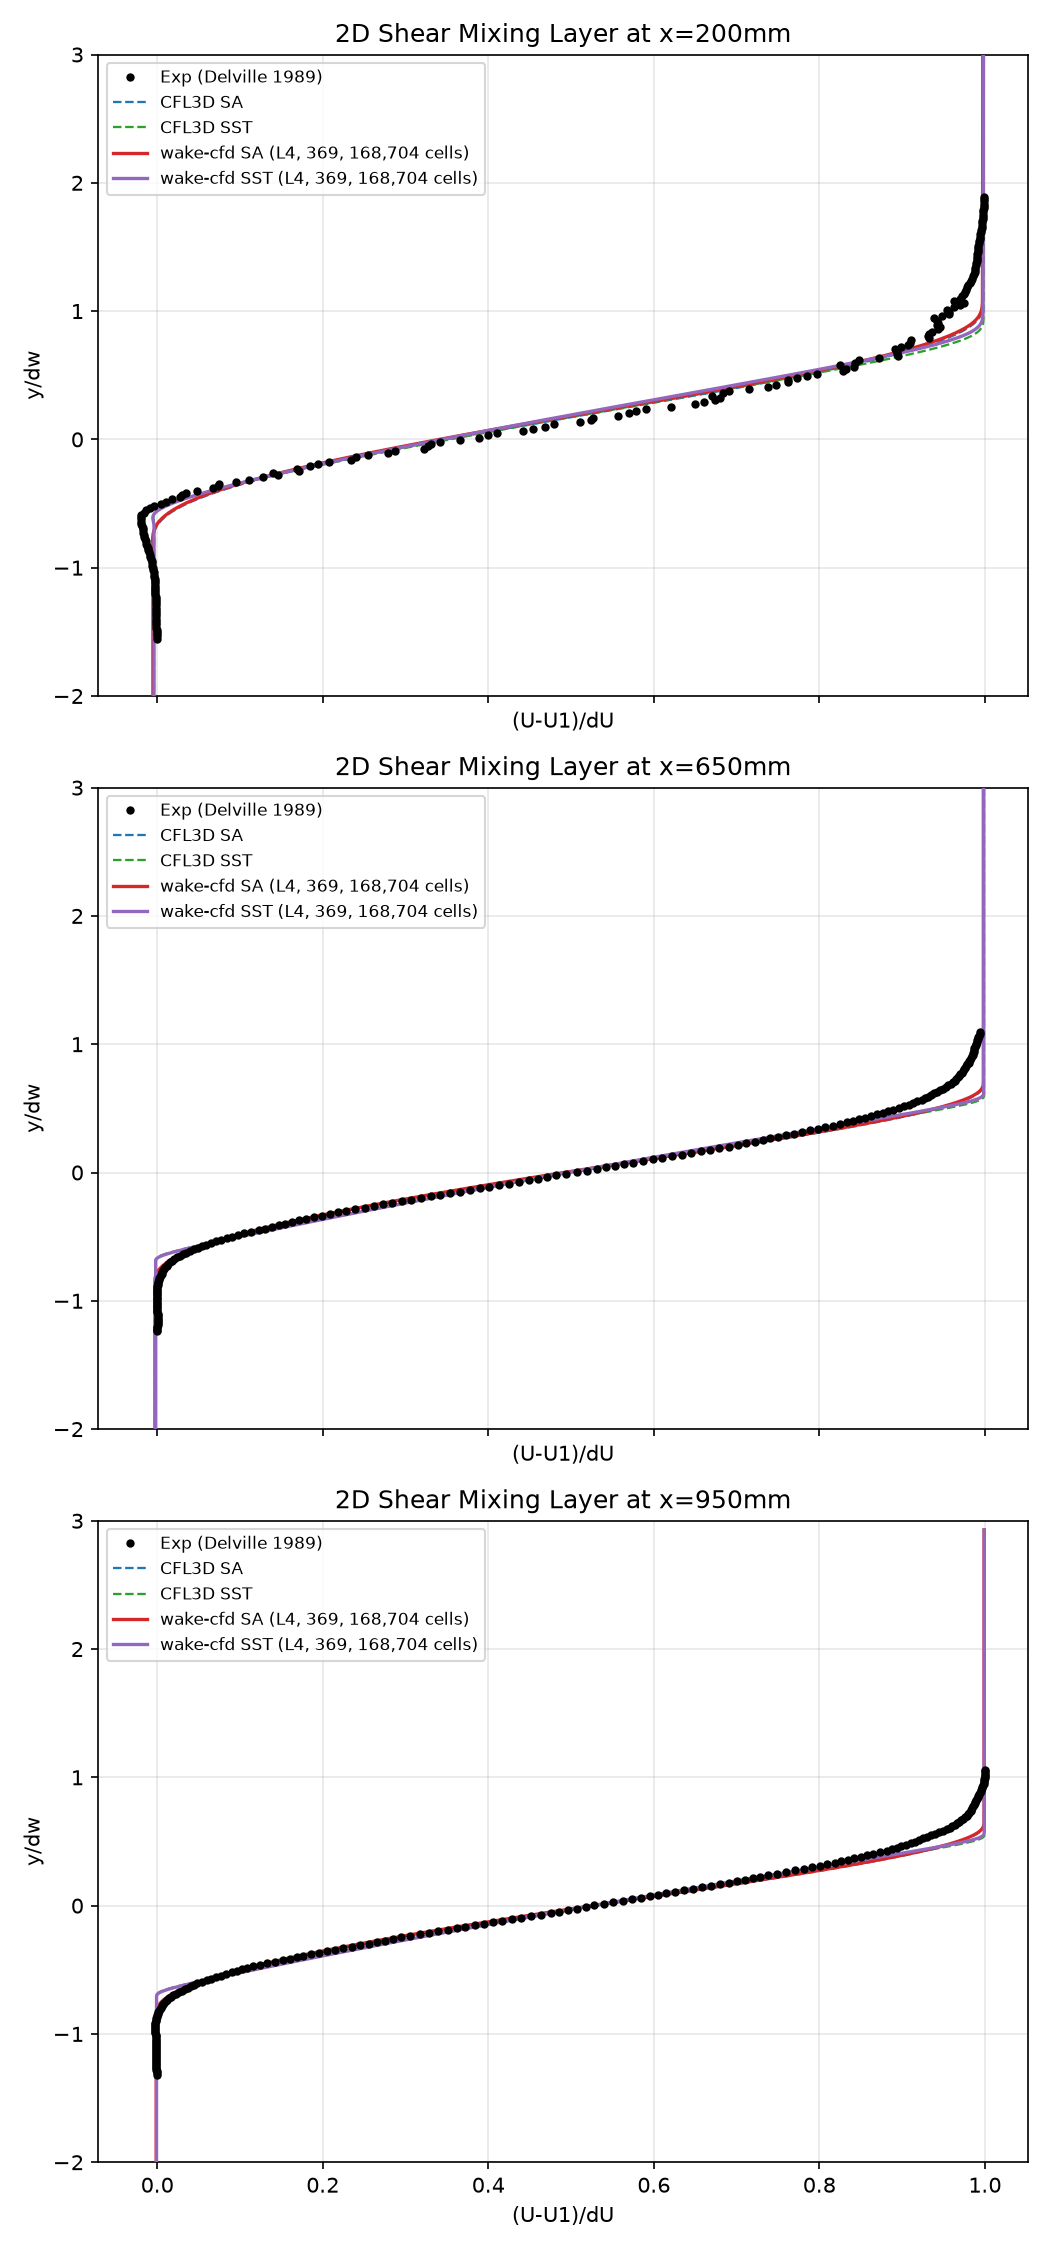
Both turbulence models were run through a grid-convergence sequence and confirmed to reach an asymptotic mesh-independent solution (SA: L3/L4; SST: L4/L5). The finest converged results for each model (SA L4, 168,704 cells; SST L4, 168,704 cells) are compared directly against the Delville (1989) experiment and the CFL3D reference solution for each model, at three streamwise stations (x = 200, 650, 950 mm).
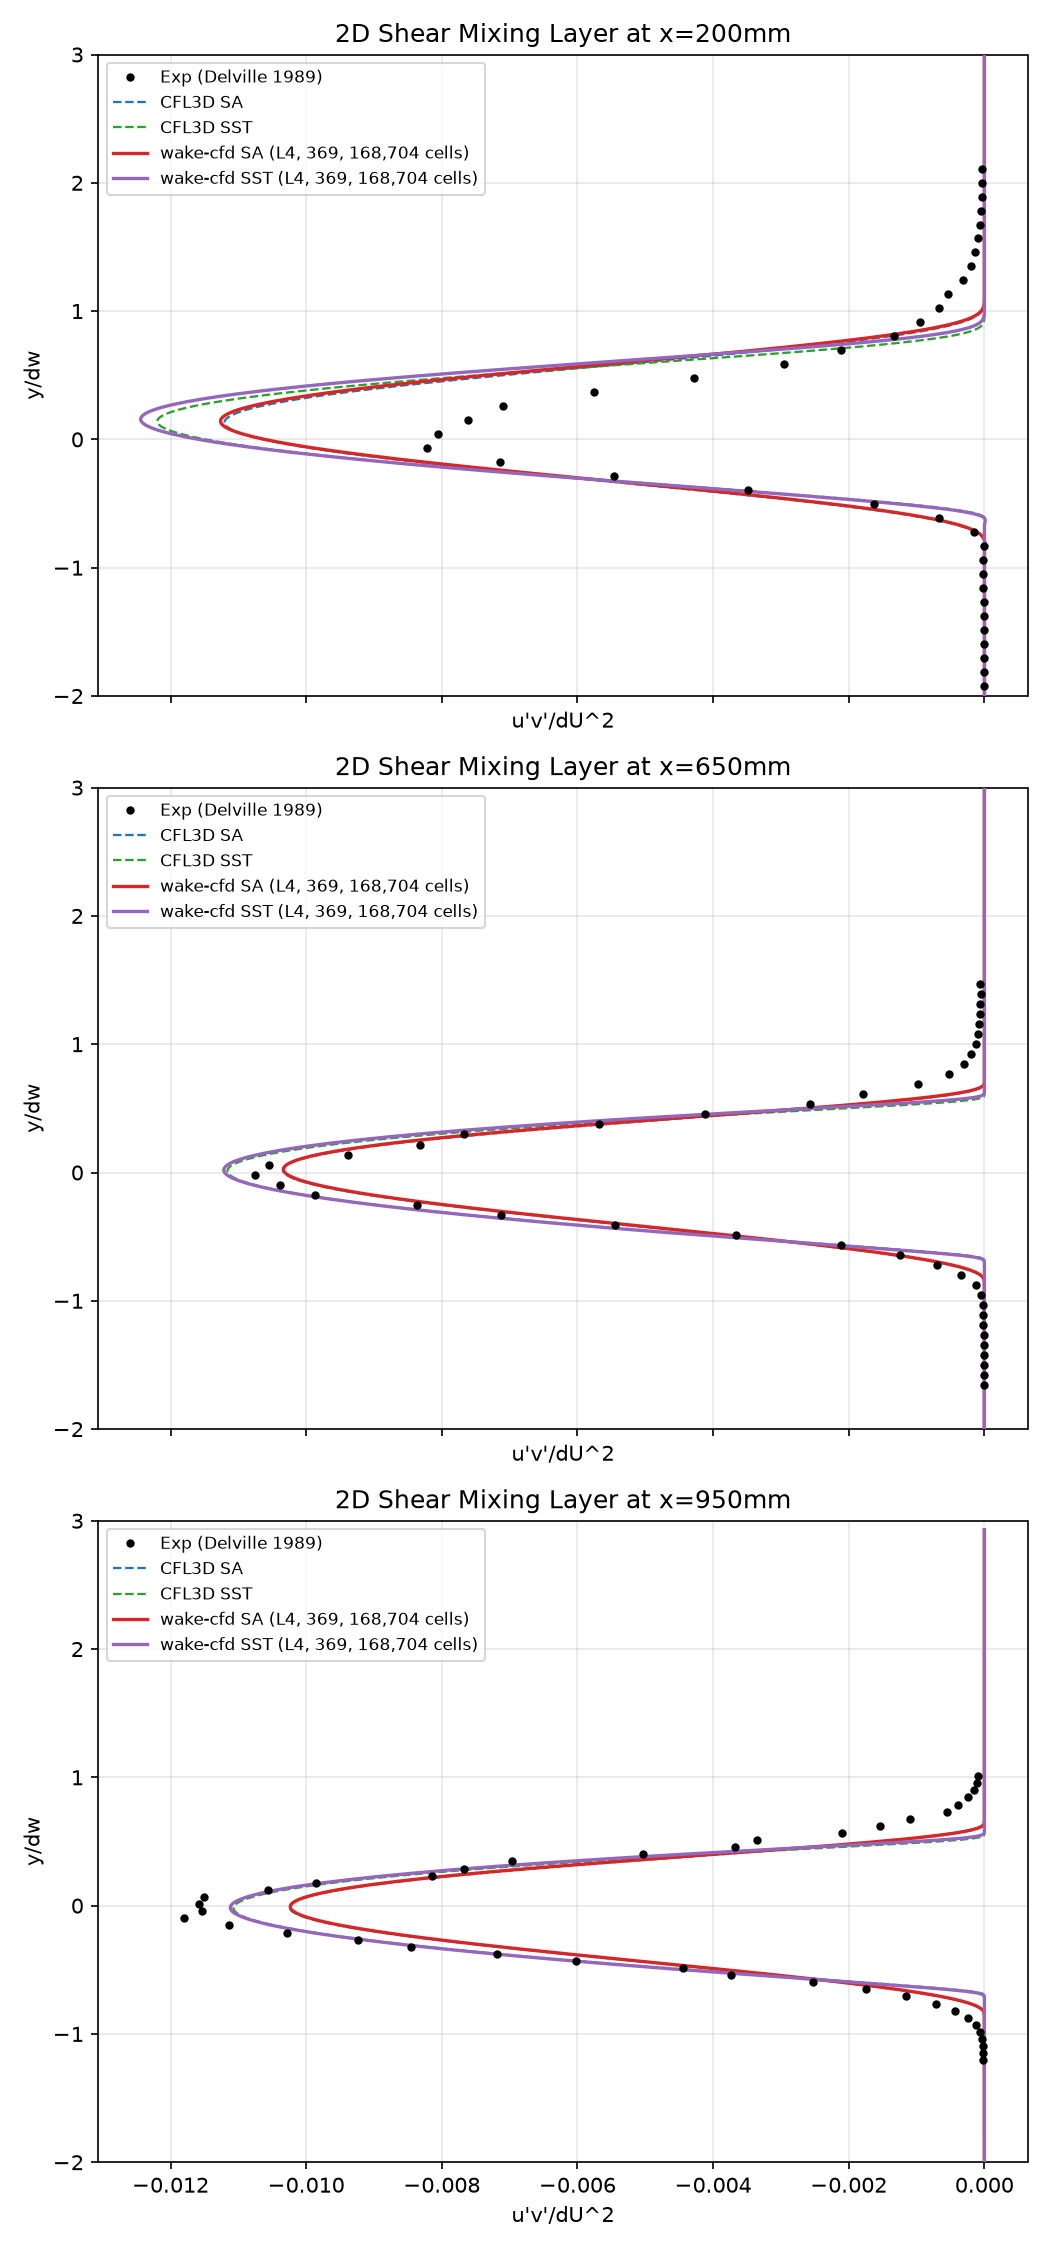
Peak Reynolds shear stress (u'v'/ΔU²) at each station, converged grid:
| Model | x=200mm | x=650mm | x=950mm | CFL3D (same model) |
|---|---|---|---|---|
| Wake CFD SA | −0.0102 | −0.0113 | −0.0102 | matches within the plotted resolution |
| Wake CFD SST | −0.0124 | −0.0112 | −0.0111 | −0.0122 / −0.0112 / −0.0111 (within 0.0002) |
Within the core mixing-layer region (|y/δω| < 3), both models agree closely with the CFL3D reference computed with the same turbulence model, confirming that Wake CFD’s SA and SST implementations reproduce the reference codes’ numerical solution. Both models also agree well with the experiment in the core region. SST reproduces the shear-stress peak magnitude and the profile asymmetry (the peak location shifted toward y/δω > 0) slightly better than SA; SA and SST agree with each other near the wall-normal center but differ measurably in peak shear-stress magnitude and shape, which is consistent with the two models’ known differences.
13.9 Conclusions and Applicable Scope
- Wake CFD’s SA and SST implementations, at grid-converged and deeply iteration-converged conditions, reproduce the CFL3D reference solution for the same turbulence model within the resolution of the plotted profiles for this case.
- Both models agree with the Delville (1989) experiment in the core mixing-layer region for this planar, incompressible, two-stream configuration.
- The comparison establishes code-to-code (SA↔︎CFL3D-SA, SST↔︎CFL3D-SST) and model-versus-experiment agreement for one specific mixing-layer geometry and one pair of stream velocities. It does not establish accuracy for compressible mixing layers, three-dimensional effects, or other velocity ratios.
- The SST run’s freestream turbulence intensity differs from the CFL3D/FUN3D SST reference’s convention value; this setup difference, rather than model or code error, is the most likely explanation for any residual disagreement near the free-stream edges of the profiles.
13.10 References
- Delville, J. et al., “Generation of Turbulent Mixing Layer with a Chevron Splitter Plate,” Advances in Turbulence 2, Springer, 1989.
- NASA Turbulence Modeling Resource, 2D Mixing Layer Validation Case.